Saint Laurent . Buying Tool
The most adaptive, flexible and intuitive buying platform that empowers buyers at Saint Laurent to achieve the perfect sell through.
Awake team
2 designers
1 executive producer
Saint Laurent Team
1 project manager
1 product owner
10+ engineers
Impact
Platform designed and shipped in 3 months
100% of required products rated; 23% with comments
Negotiation time reduced 67%: 30 hrs → 10 hrs
Debrief creation time reduced 83%: 12 hrs → 2 hrs
My role
During Paris Fashion Week, I shadowed and conducted user interviews with buyers and merchandisers at Saint Laurent to gain firsthand insight into their workflows and decision-making processes. I partnered with the team to define the product concept and overall design direction, led collaborative workshops with buyers to validate assumptions and refine the direction, and carried the work through design execution. I also co-presented the final product concept and design rationale to key stakeholders at Saint Laurent for buy-in.
Frustrated by their outdated infrastructure, Saint Laurent partnered with Awake to design and develop a modern buying platform optimized for improved sell-through of their collections.
Our producer and I shadowed Saint Laurent buyers at during Paris Fashion Week, observing their negotiations and understanding the full user journey.
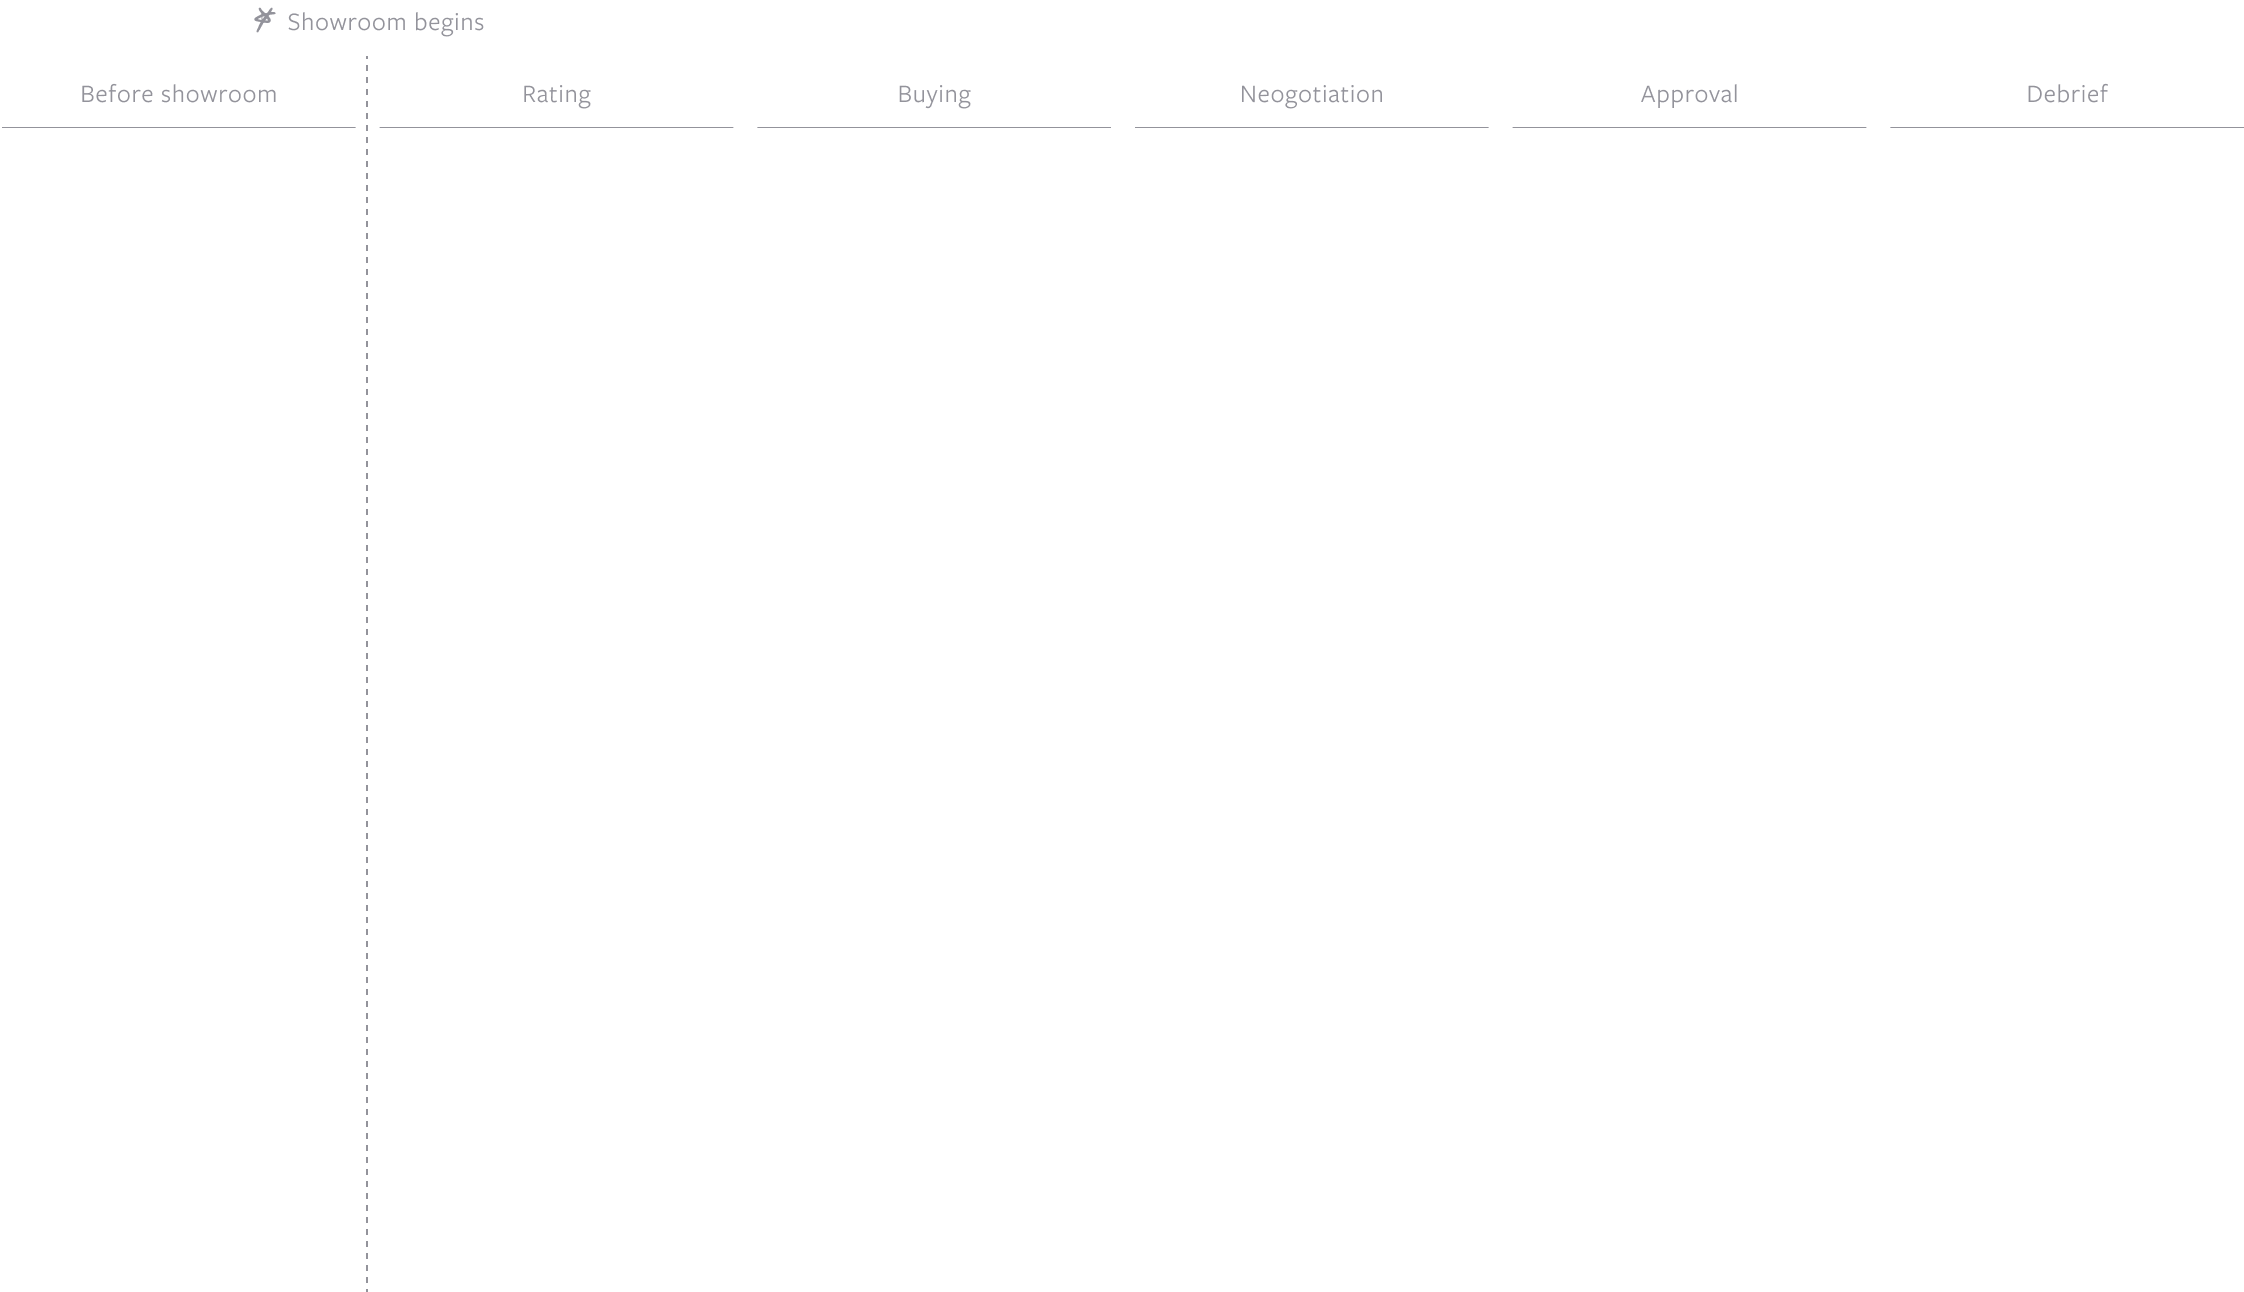
In addition to shadowing, we conducted interviews with buyers and merchandisers from all regions and departments. We learned that:
Rating the new collection should be simple, not adding extra work.

Excel sheet system is tedious - buyers anaylze years of Excel sheets and negotiations rely on printing out those sheets. This is time-consuming and they would like more time to be creative.

Stakeholder communication is inefficient and lacks transparency. Collection updates are shared via emails and by reprinting line lists. Different regions don’t have awareness of each other’s decisions.


Based on our research, we identified 3 main “how might we’s"
With over 1,000 products per collection, how can buyers rate efficiently and accurately to inform future collections?
How might we enable buyers to be creative with their buys, while still having access to all the KPIs they need to back up their decisions?
How might we enable buyers and merchandisers to communicate more transparently, and efficiently?
Problem 01 . Rating over 1000 products
We explored 3 approaches. The first one was rating by question. Each product is rated on 4 questions. The buyer rates every single product for the first question, then every product for the second question and so on.
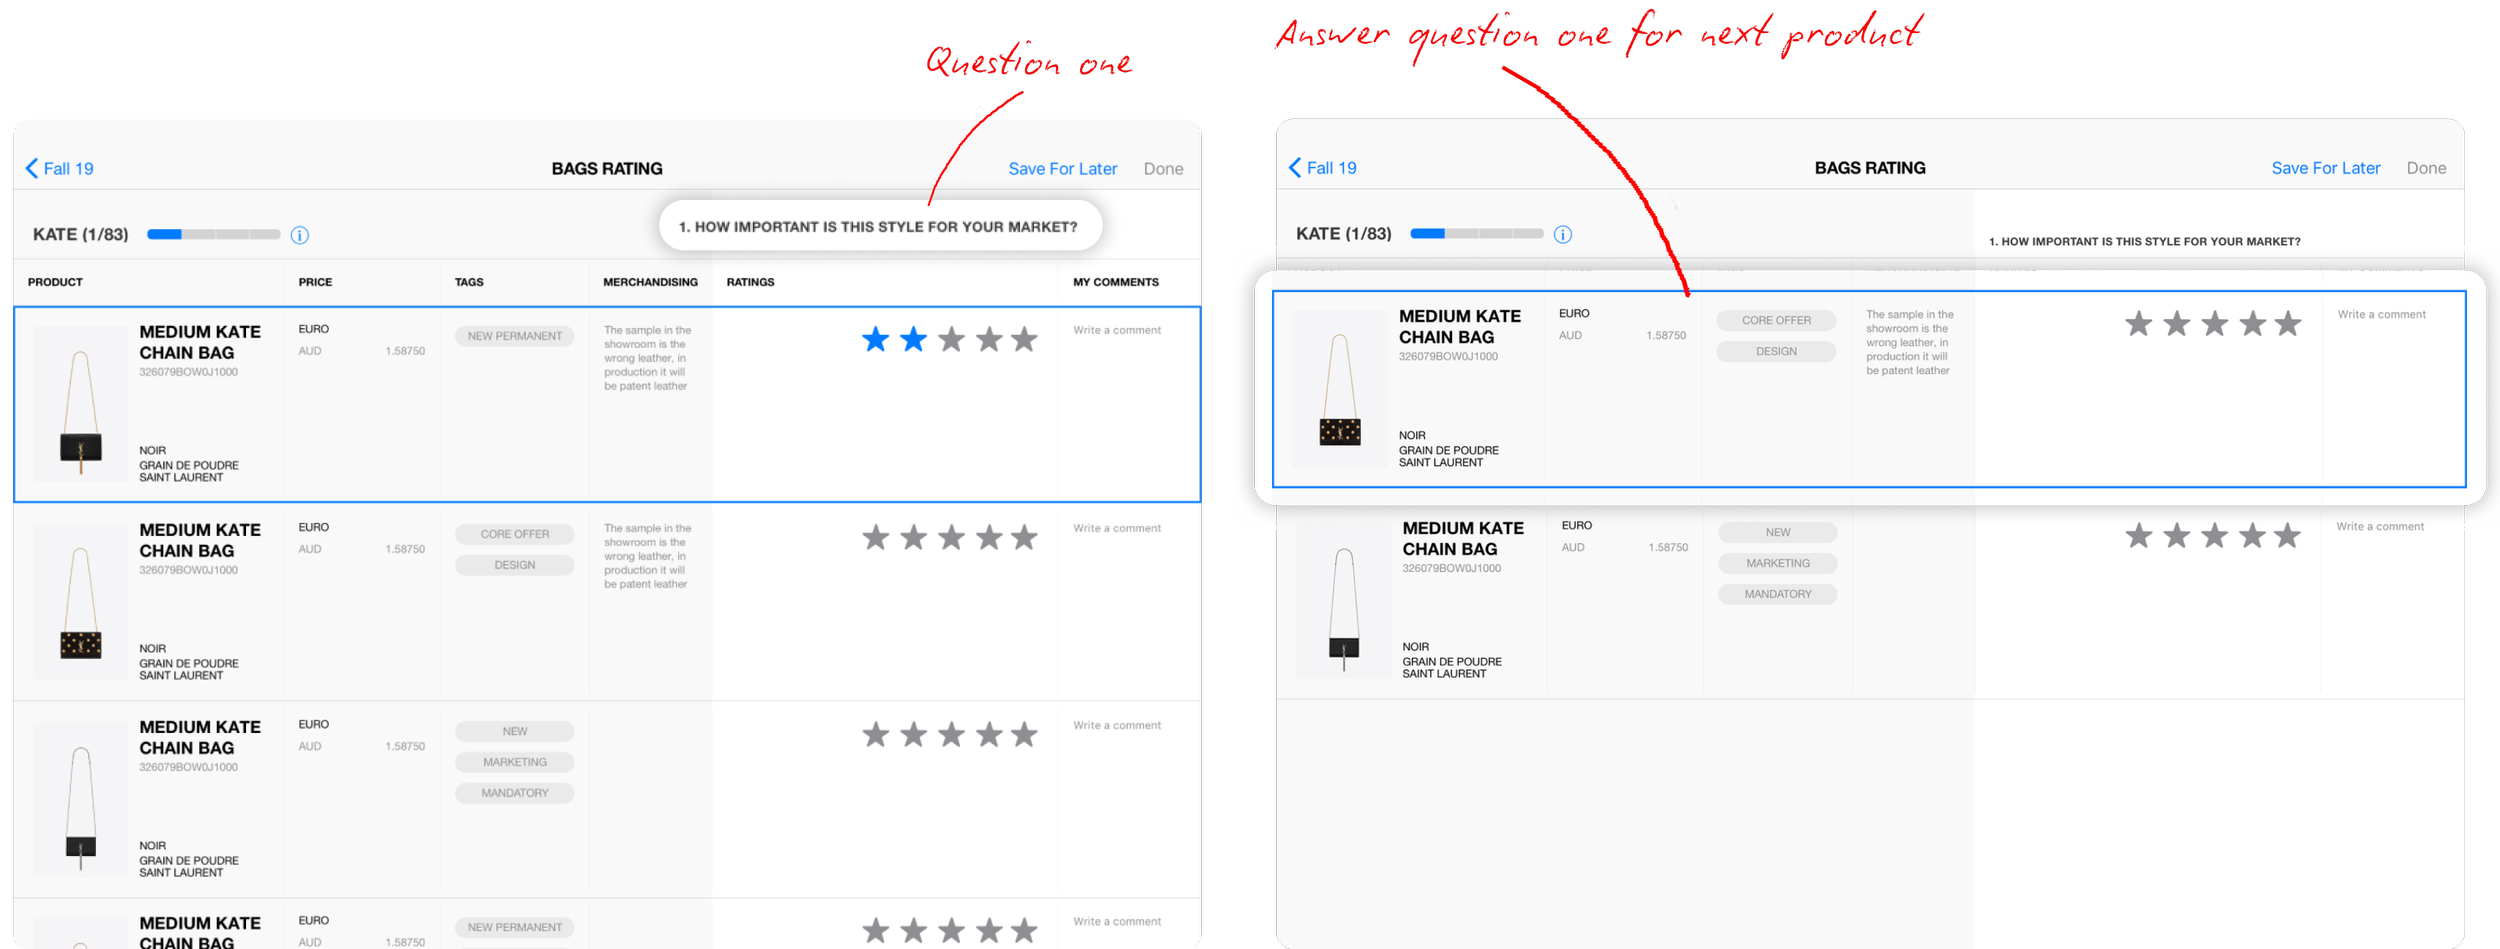
The second approach was rating by SKU, with all questions shown in the same view
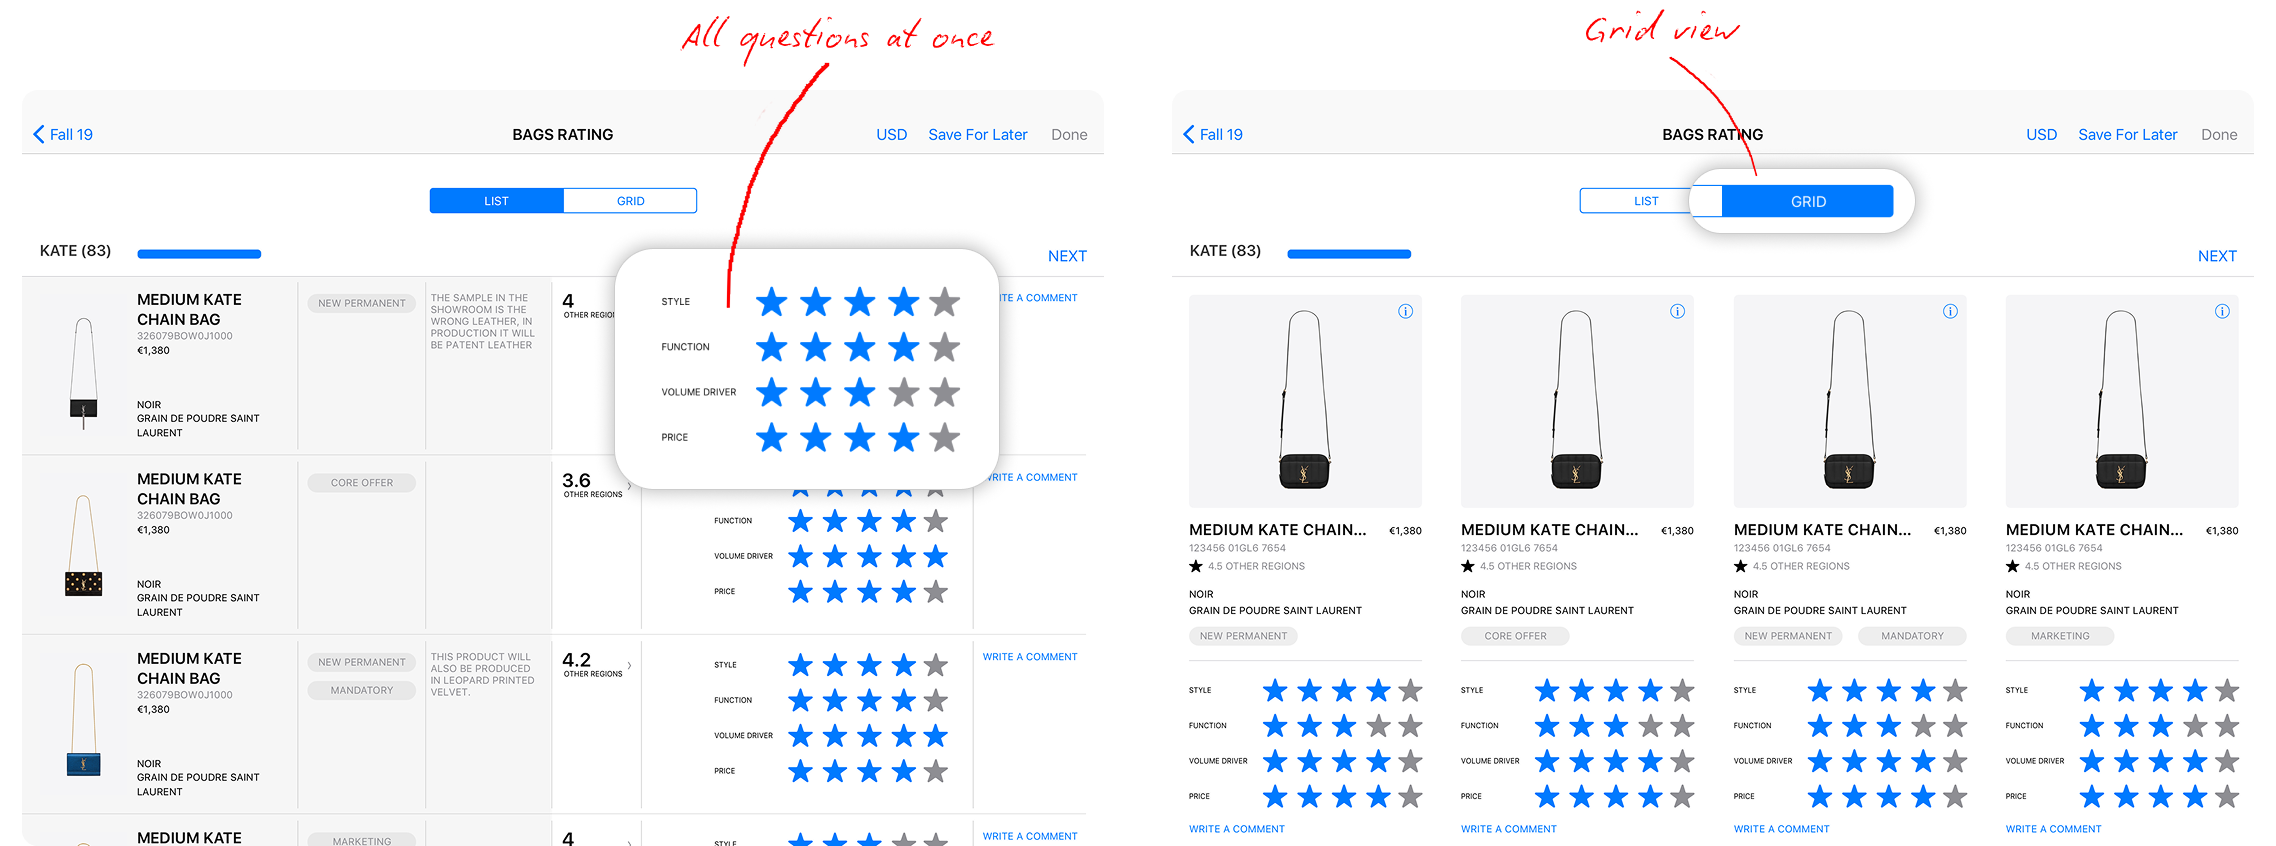
The third approach was rate by SKU, one question at a time. The buyer rates a product by all 4 questions and the moves onto the next product.
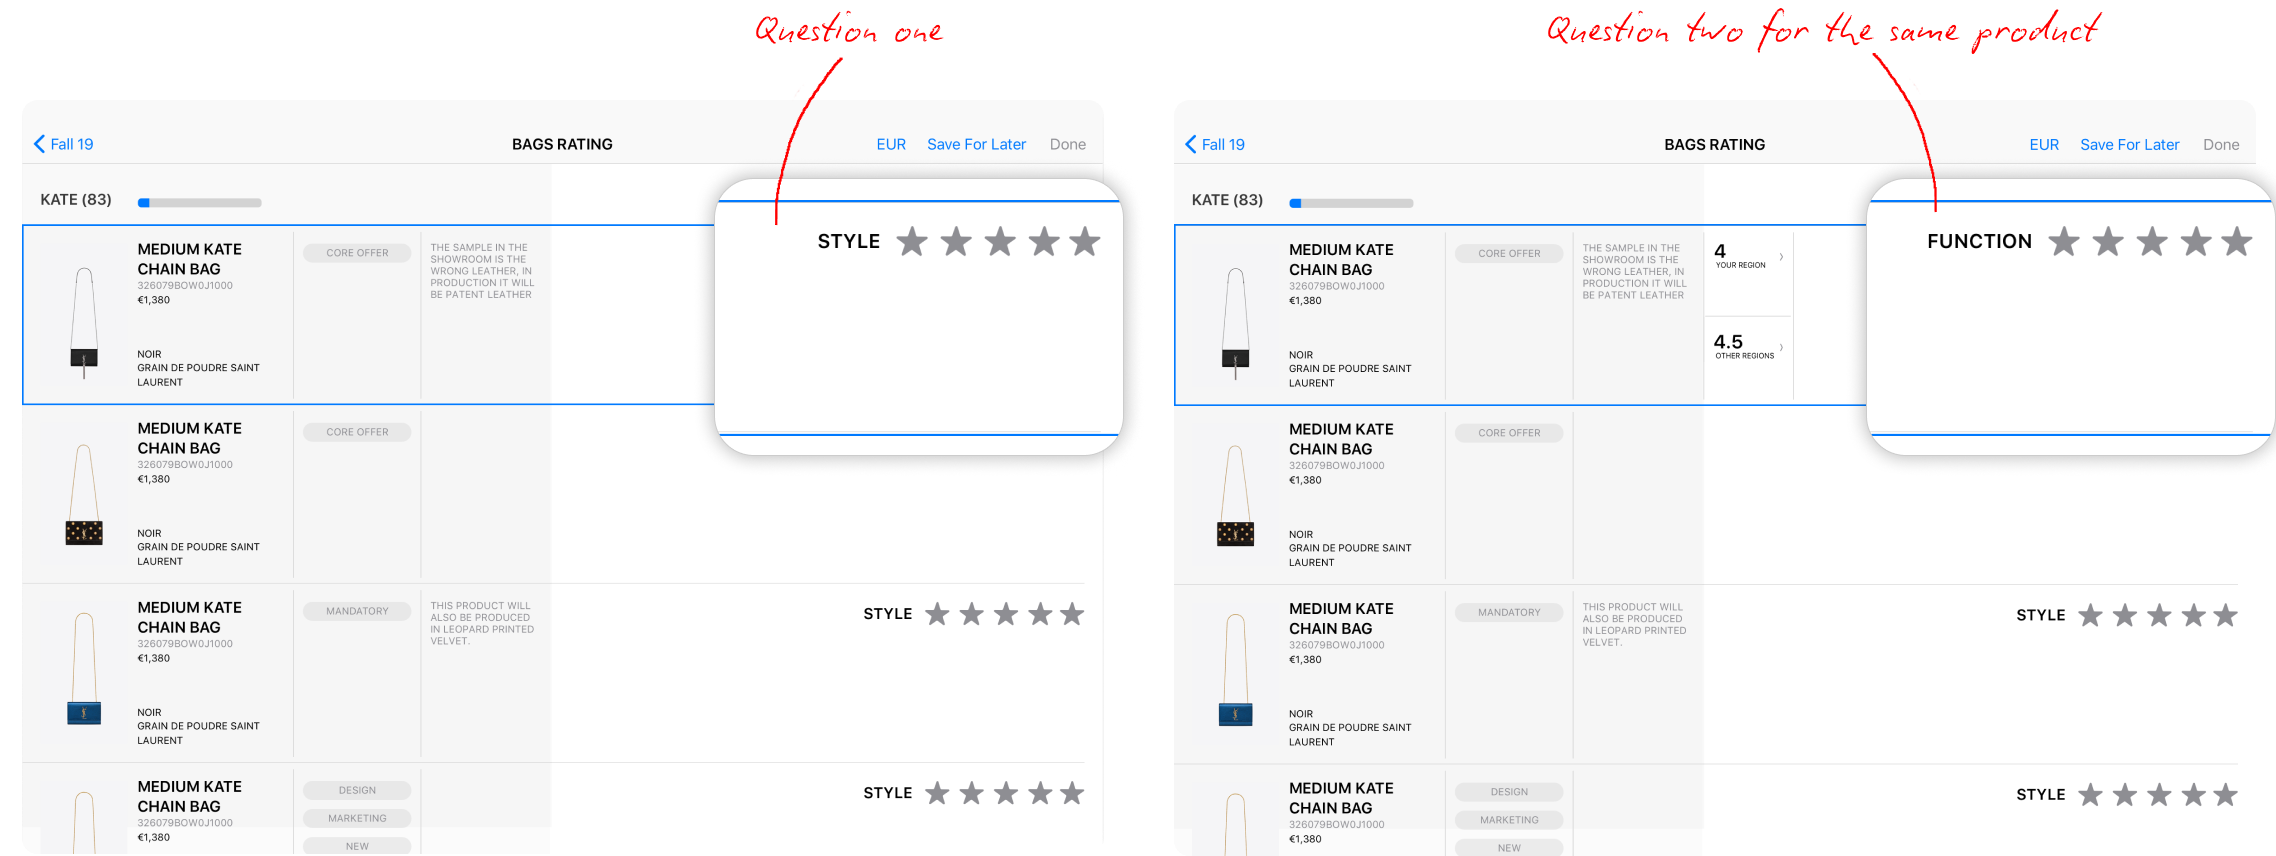
After prototyping three versions and testing them with buyers, it was clear that rating 1,000 products wasn’t practical. We pivoted to require ratings only for mandatory buys and those buyers felt strongly about.
We also learned that buyers prefer viewing multiple products at once and sorting them to consider each product’s place in the collection. We adjusted the design to allow filtering and searching in list and grid views for flexible, personalized rating.
Problem 02 . Balancing creativity and data
We began laying the foundations for the tool by referencing buyers’ Excel system, which was robust but tedious. For example, buyers had to compare this year’s quantities with a separate sheet from last year. The buying process is also highly creative, requiring buyers to ensure their selections align with the season’s visual story while reflecting their region’s distinct tastes—something Excel sheets cannot support.
Considering all of this, we designed three buying spaces: grid, list, and analytics view.
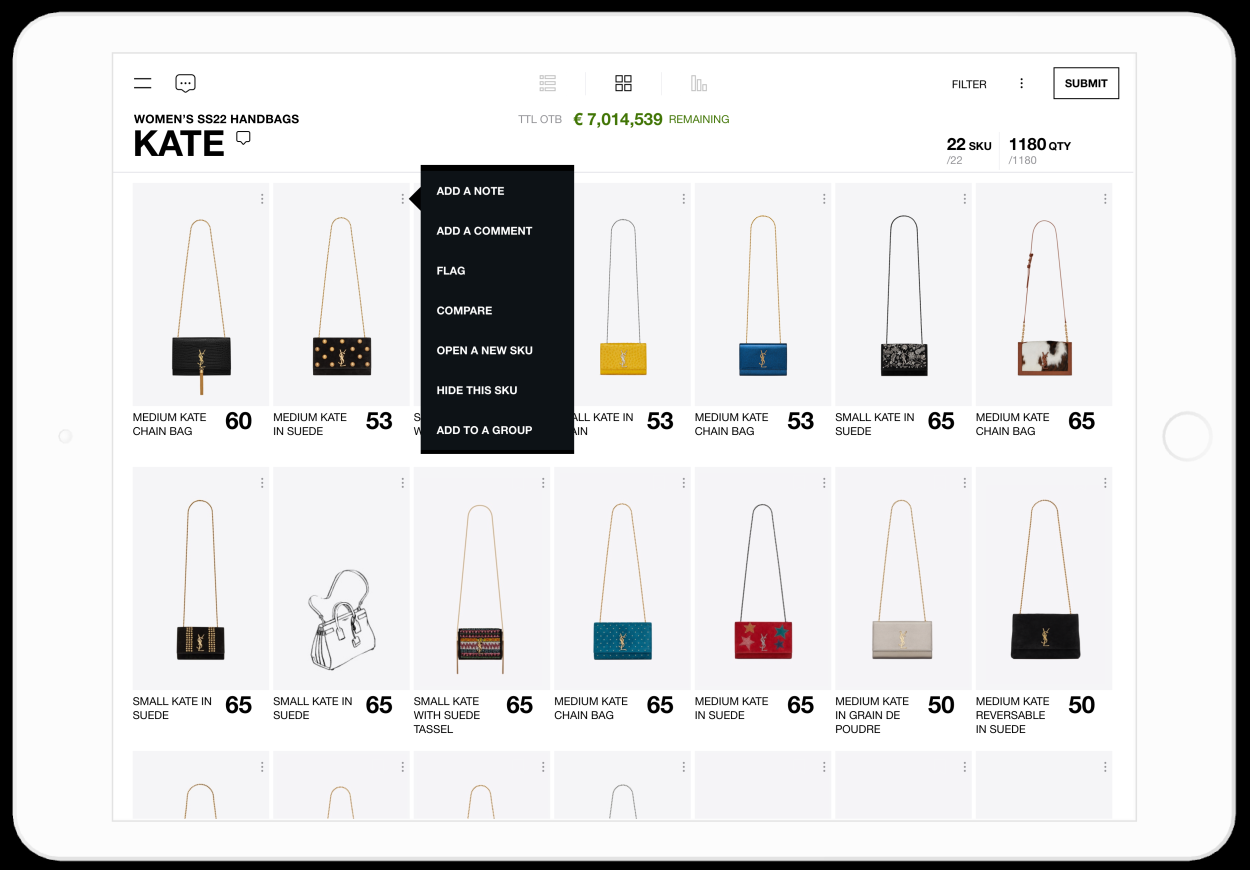
Grid view
Grid view is the default, showing large product photos with minimal details and allowing buyers to remove unwanted items. This helps them track key visual stories in the collection.
List view
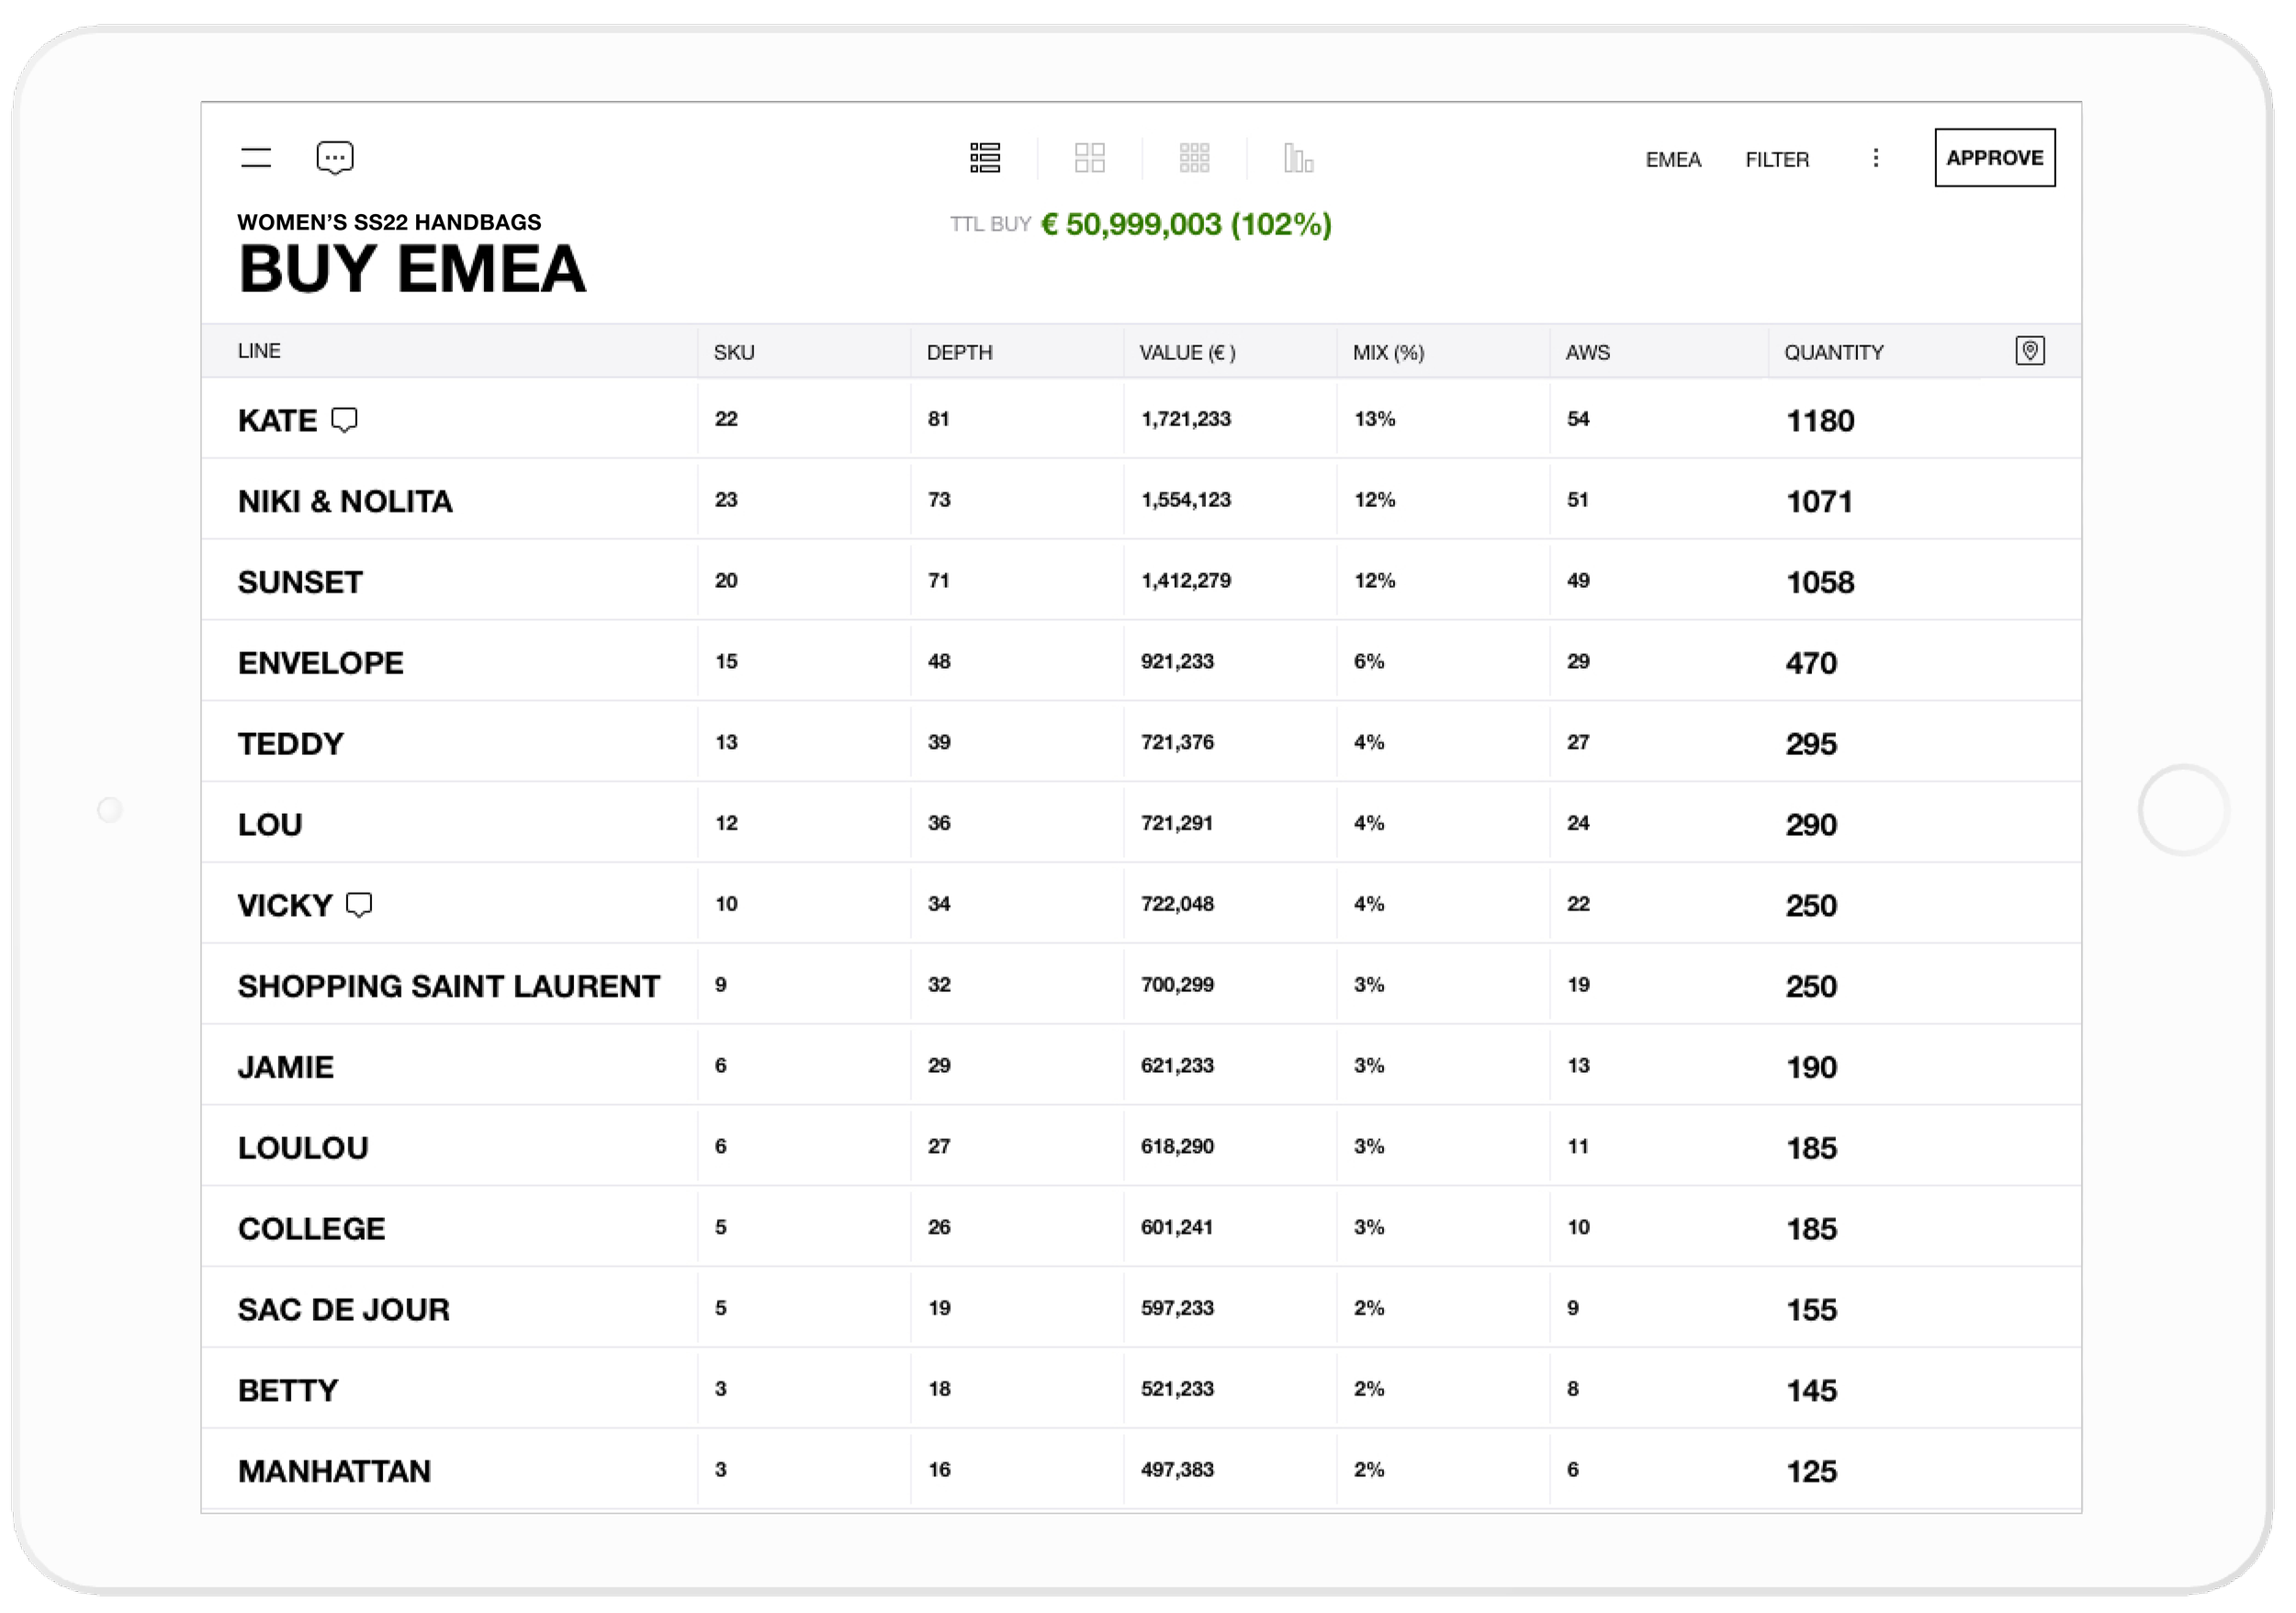
In list view, buyers can see their selection with additional details such as comments from design and tags by the merchandisers. Based on this information, buyers can enter their quantities.
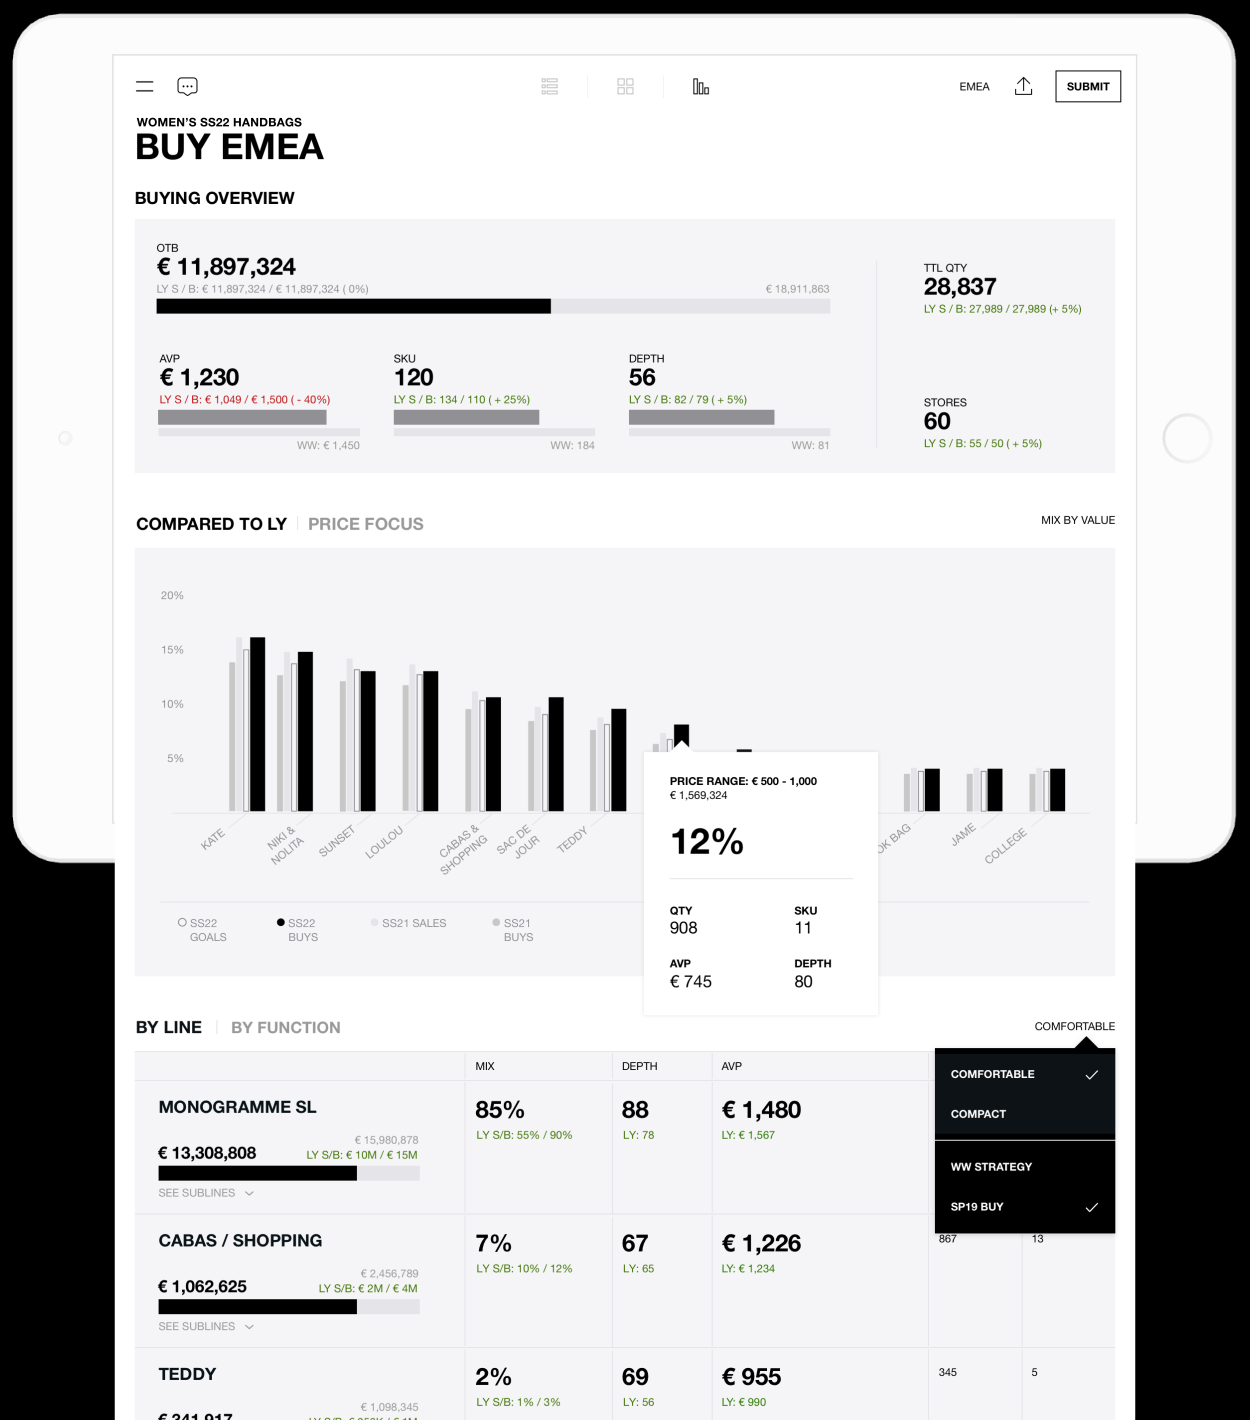
Analytics view
Currently, to back up their buy with data, buyers compare their Excel sheets to charts and graphs about past seasons printed out on paper. We designed the analytics view based on this system, adding enhancements like last year’s comparisons and HQ guidelines to keep buyers on track.
Iterating on the 3 initial views . Group view
Based on buyer feedback, we added a fourth view, Group View, where buyers can group products into stories. Buyers already create themes, but now they can do it in a more visual way, helping ensure their selections align with the season’s visual story.
Iterating on the 3 initial views . Compare view
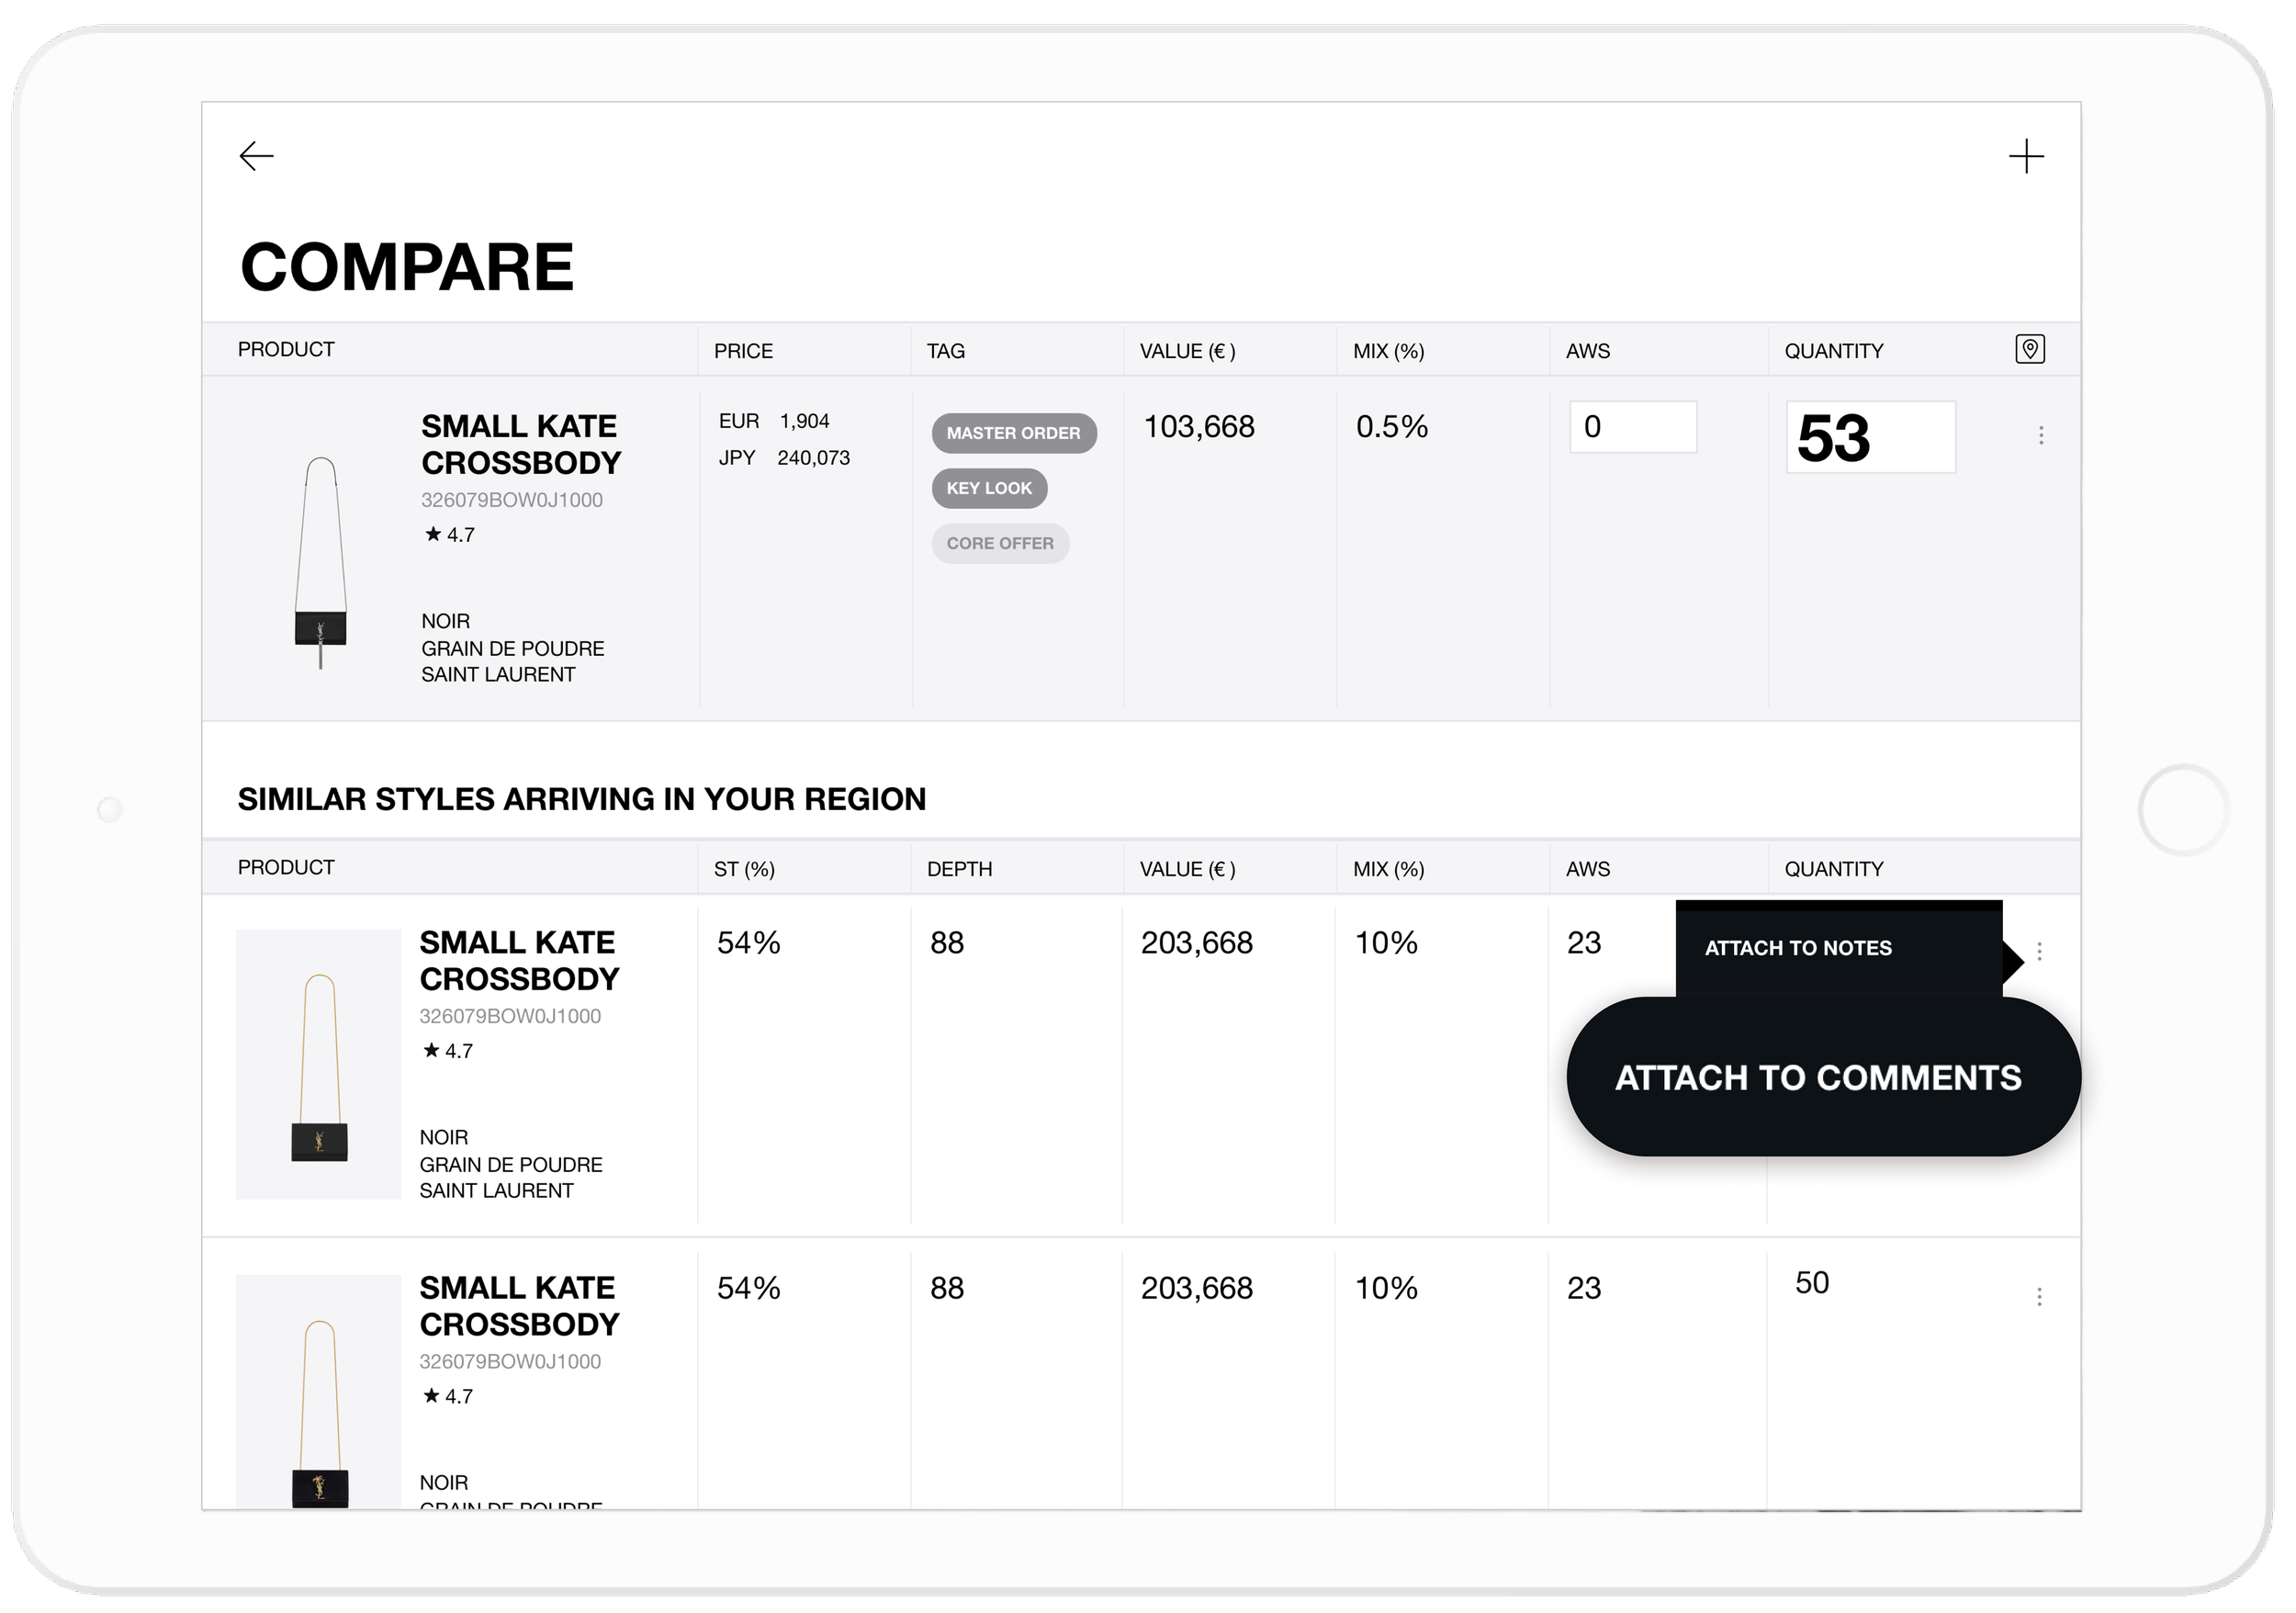
Buyers need to be able to compare past buys with the current buy. For example, if they see that they’ve bought a certain visual for the fall, they won’t buy certain SKUs for winter because winter and fall products will appear in-store simultaneously. In addition, buyers also compare the current buy with similar products in transit to stores and from last season.
We added a Compare View that buyers can access from list, grid, and group view. In this view, buyers can compare their buy in terms of data and visually. Buyers can automatically see similar styles in this collection, arriving in their region, and already in store.
Buyers can also visually compare this entire season to the entire previous season.
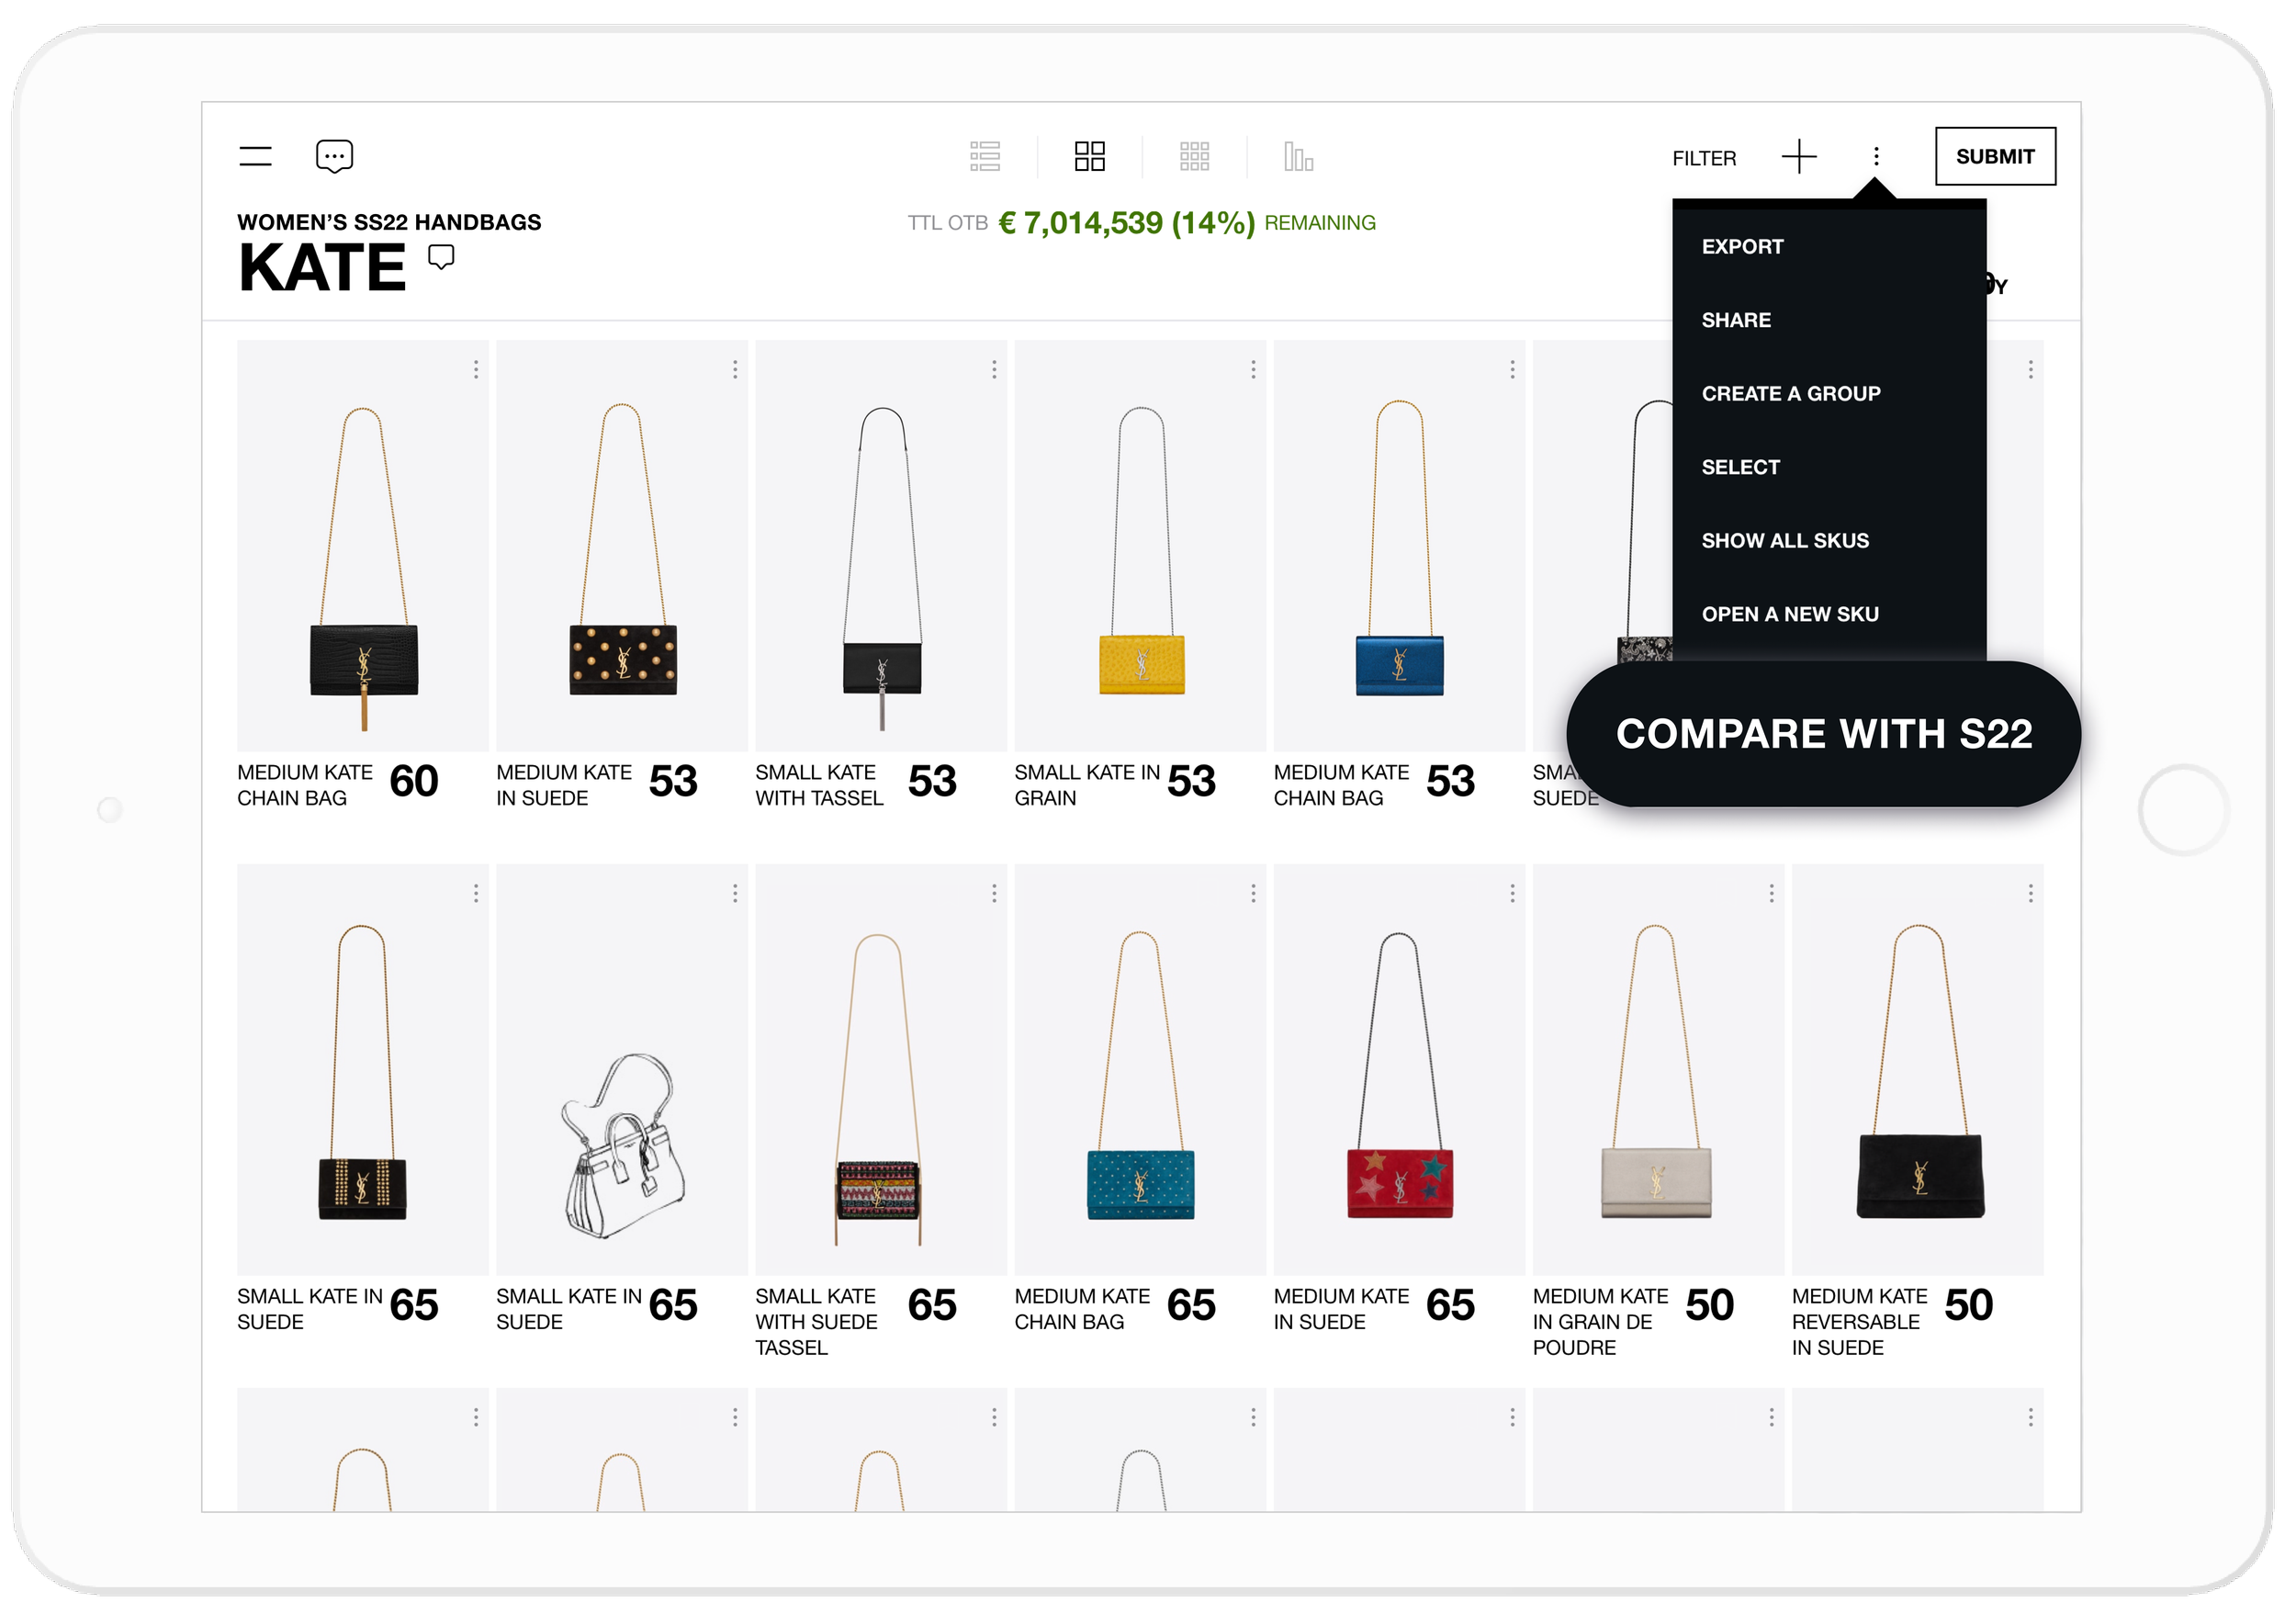
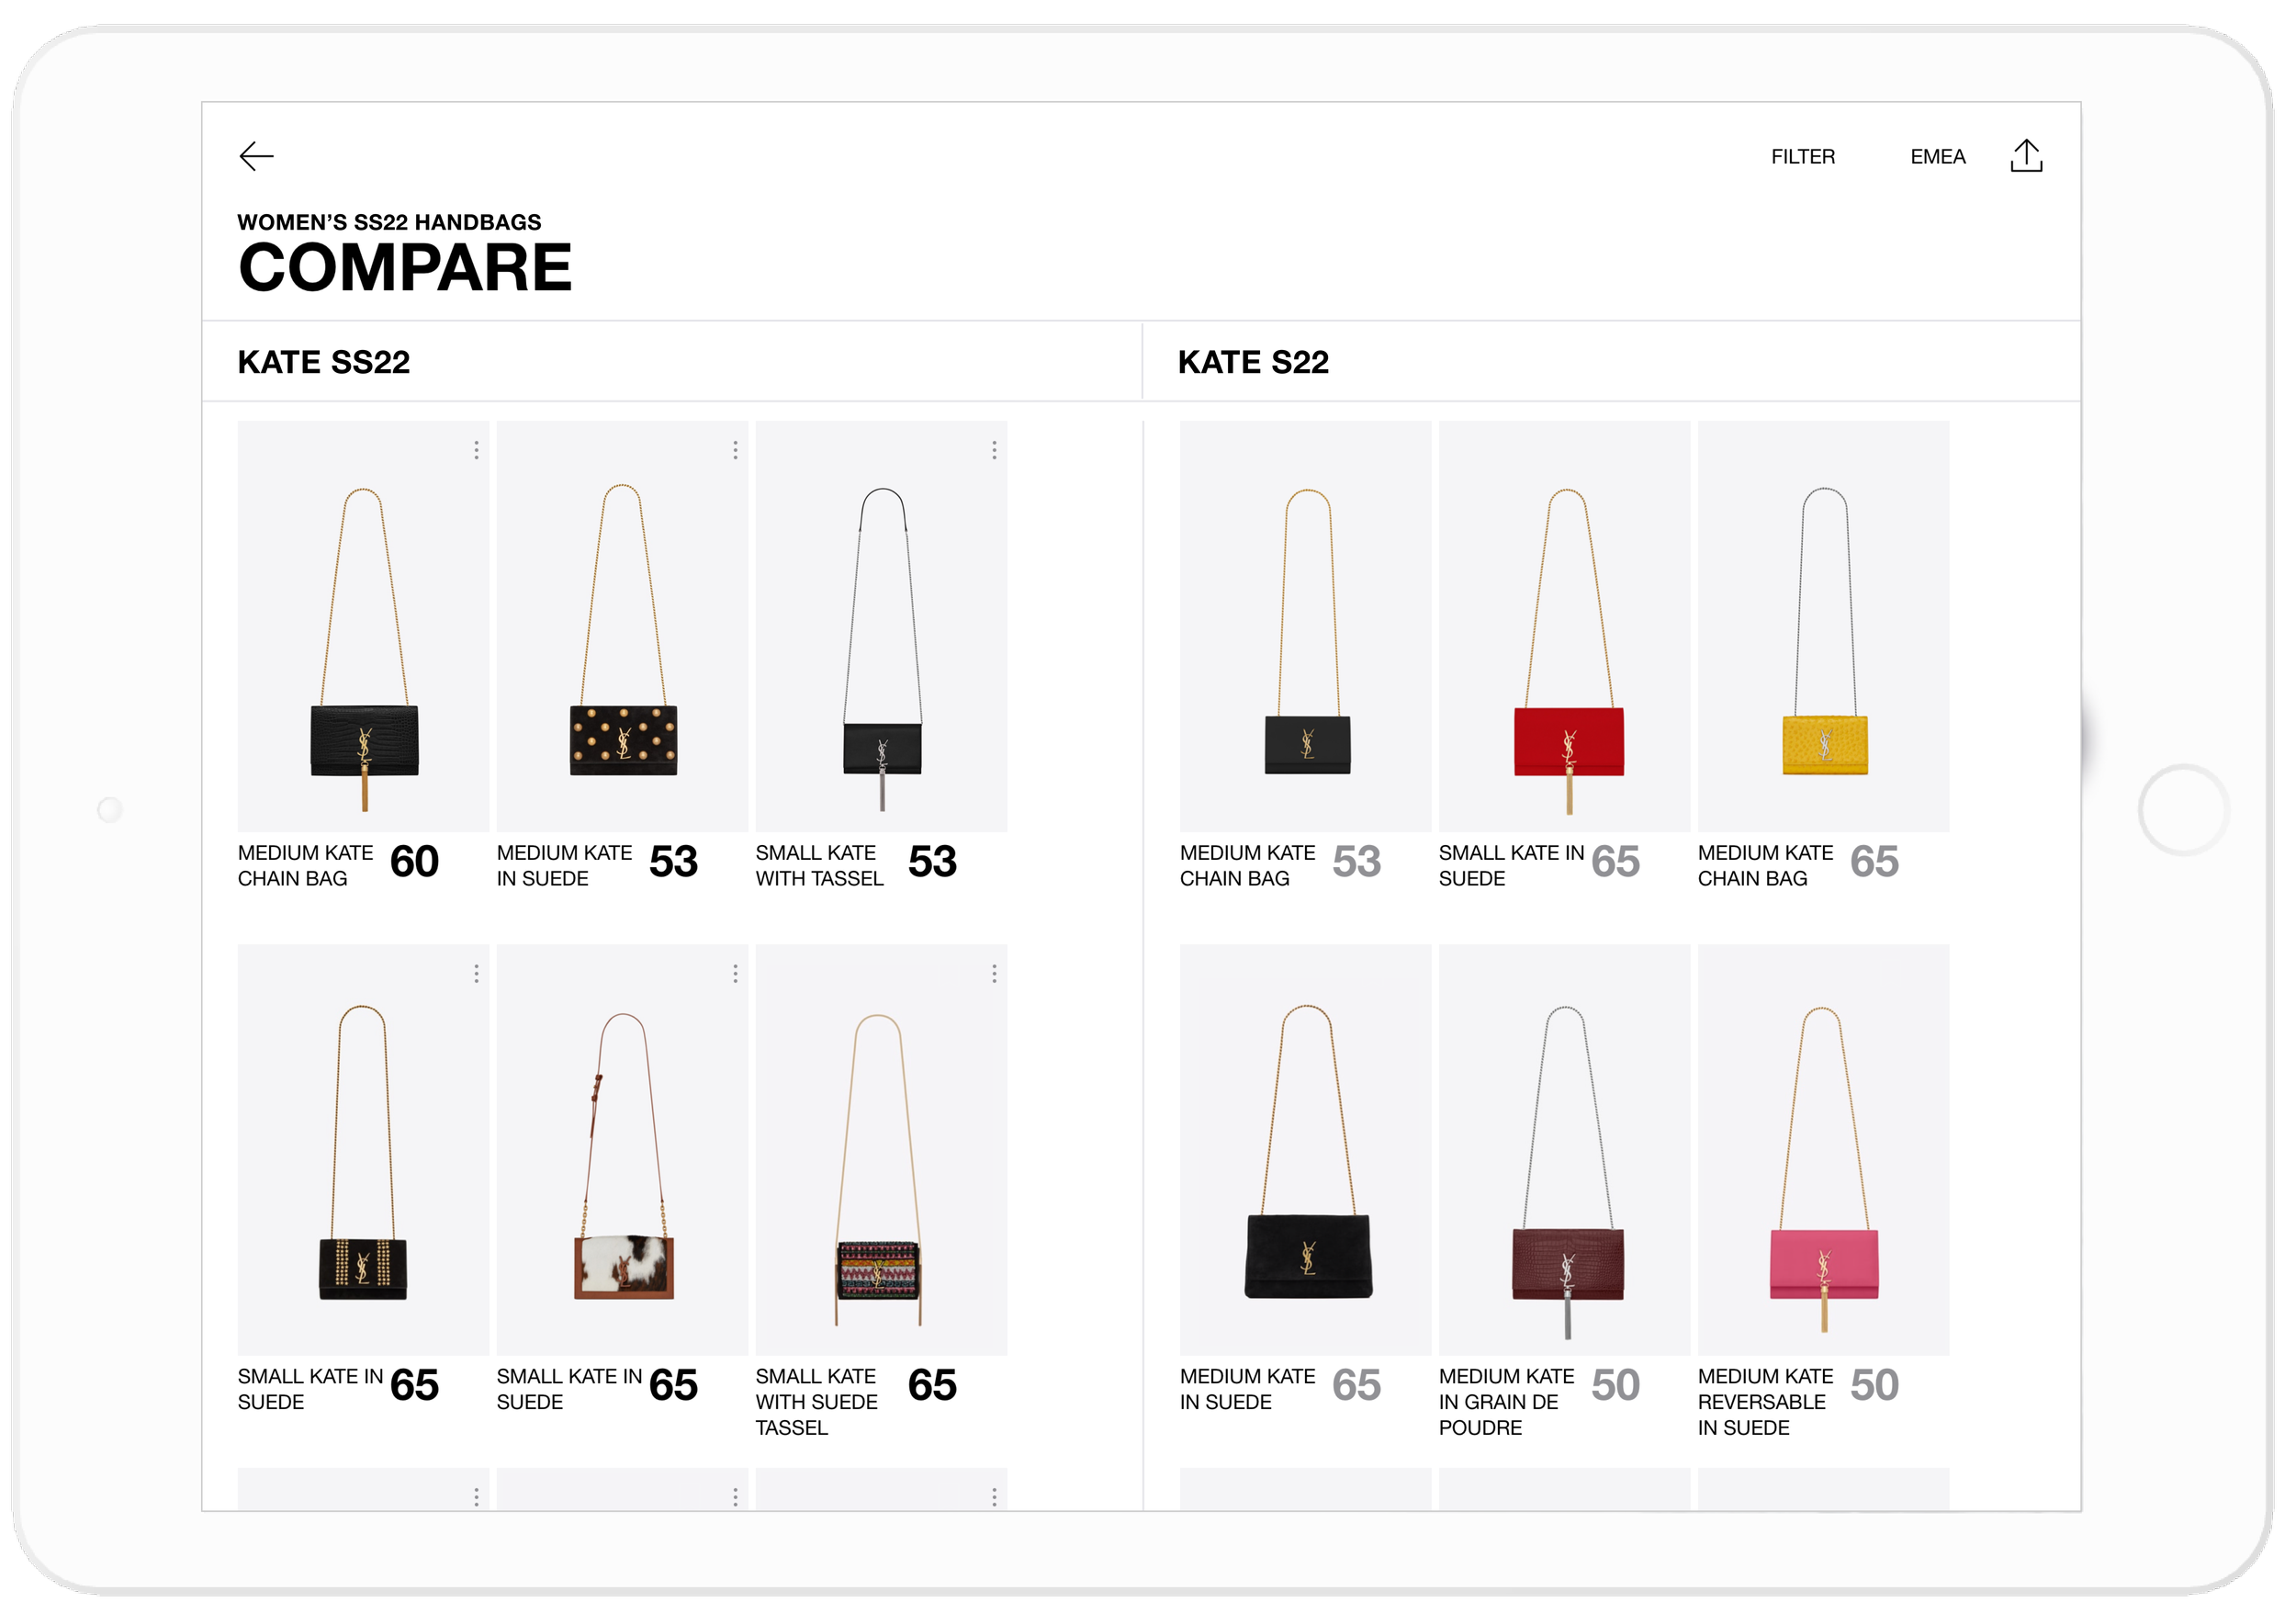
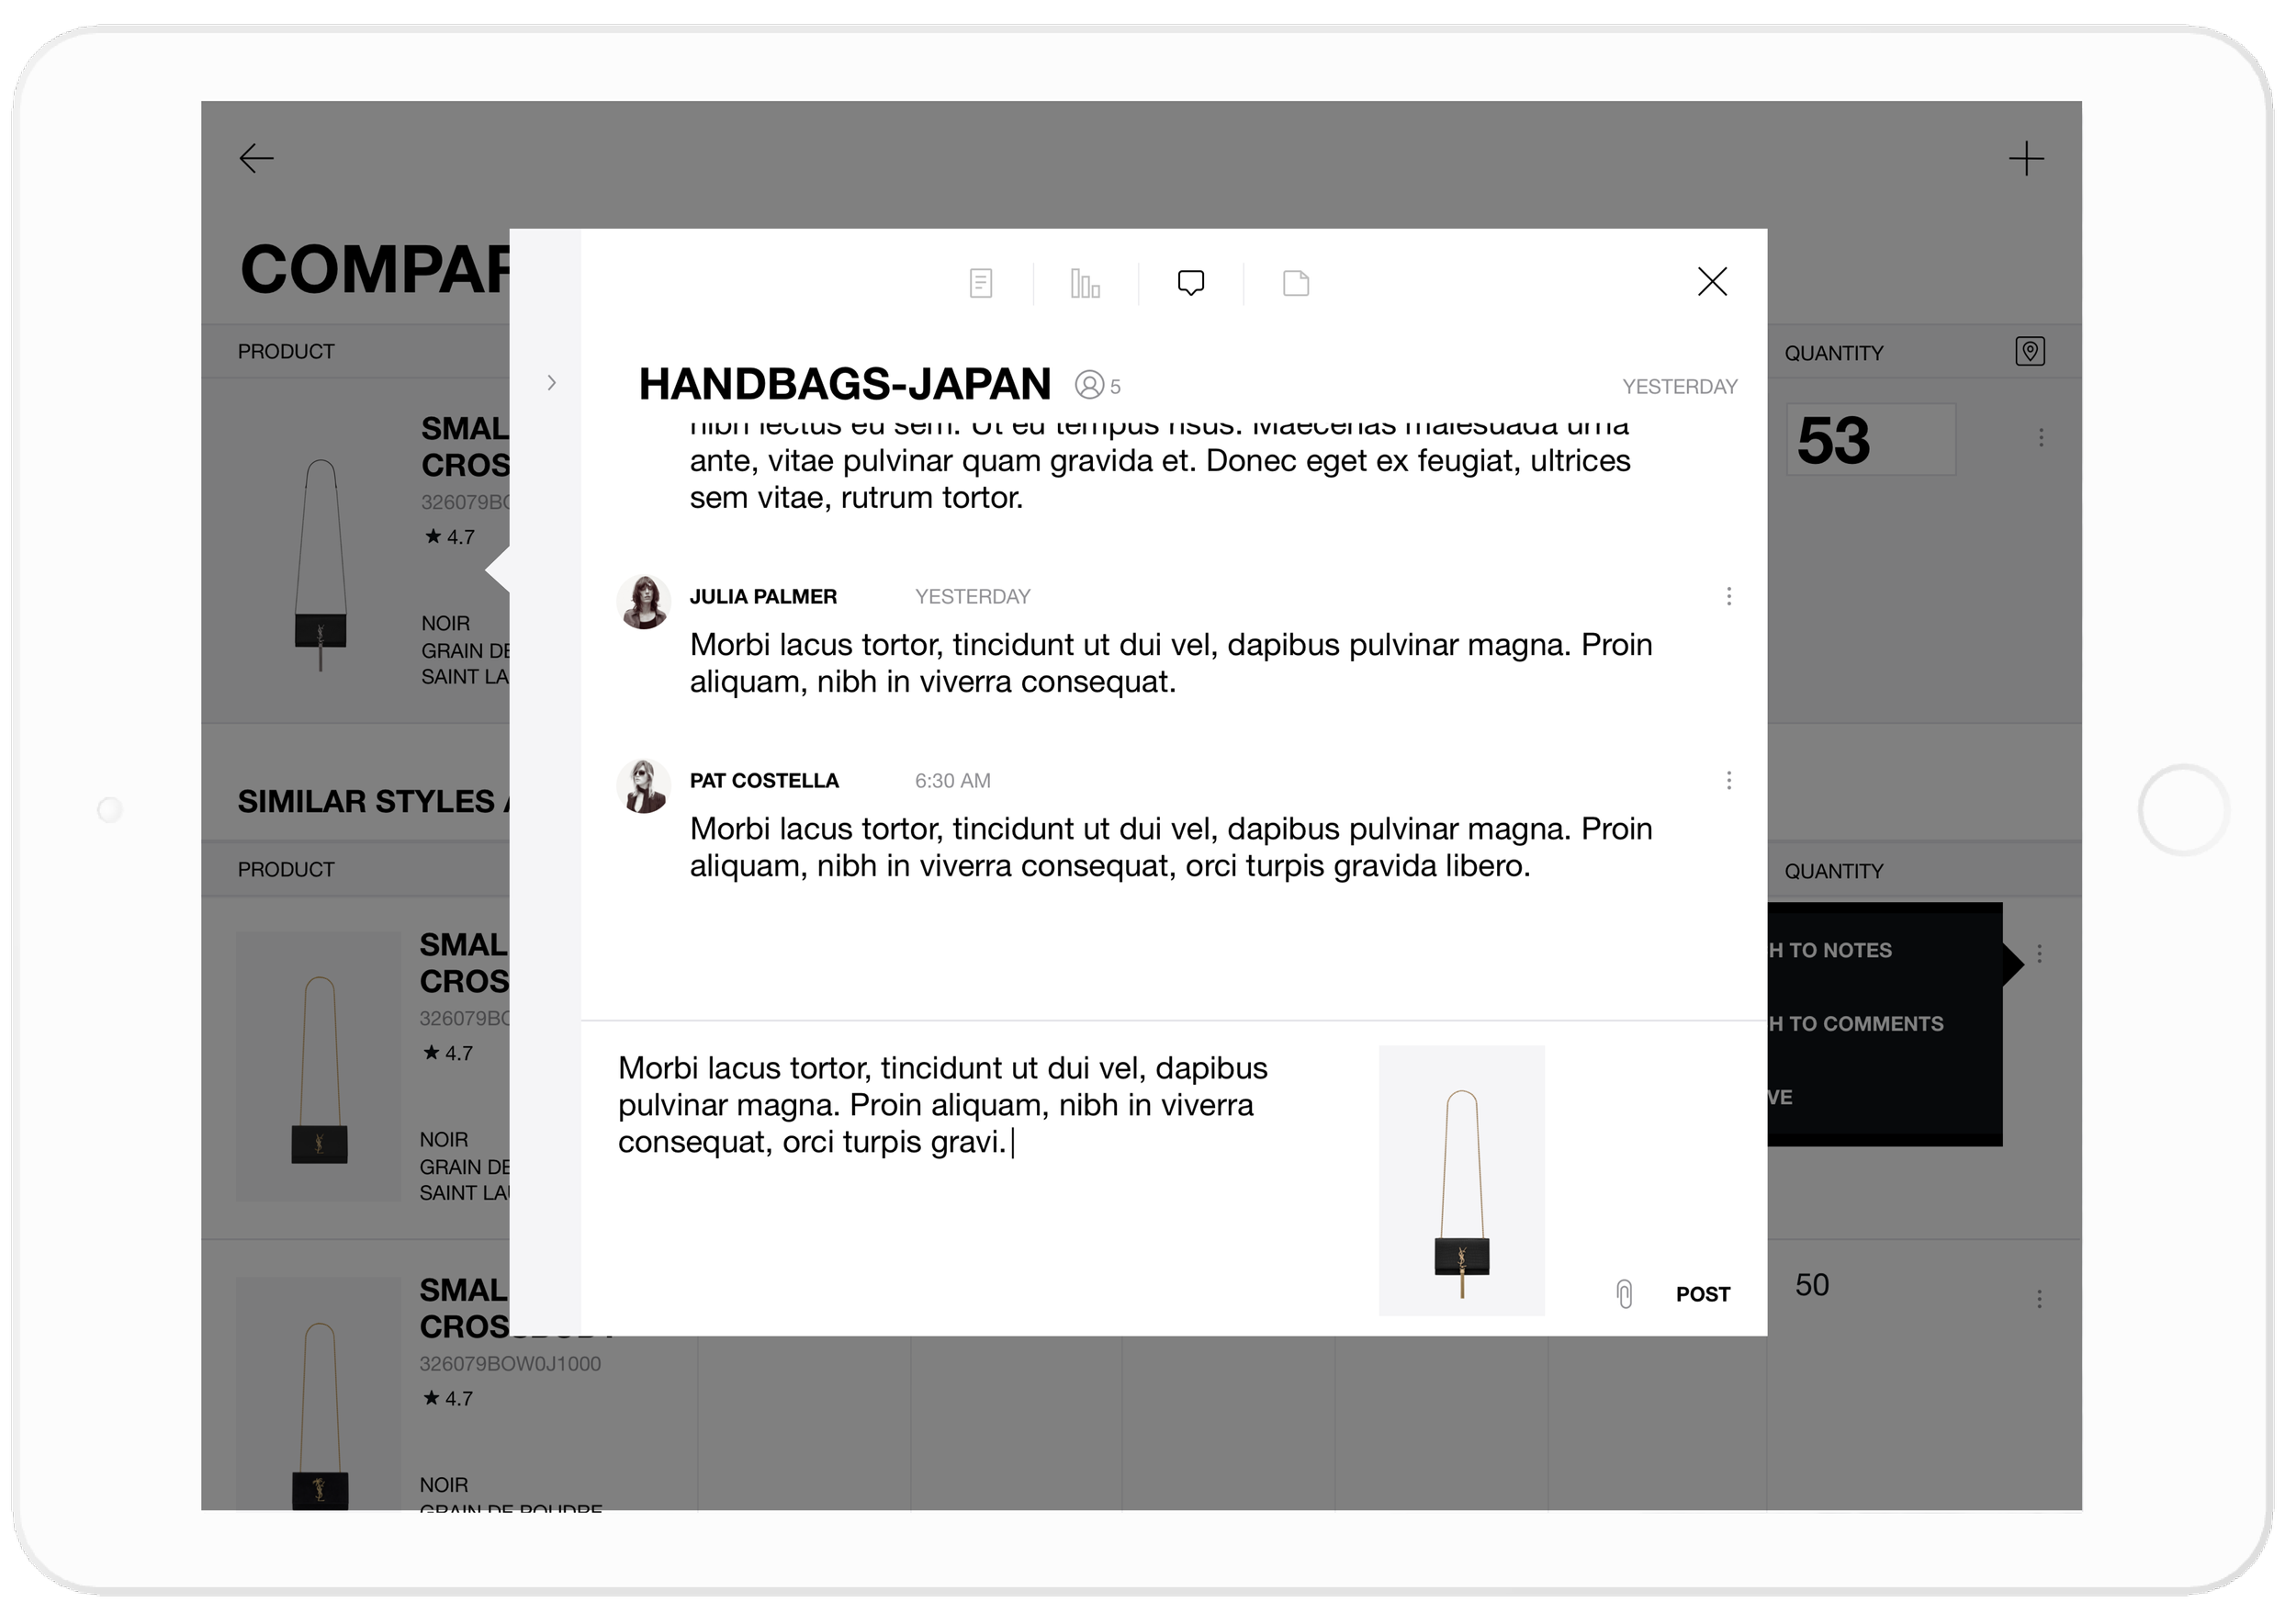
Buyers can attach the data discovered in compare view to personal notes and conversations with other buyers and merchandisers to back up buying decisions.
Problem 03 . Transparent communication
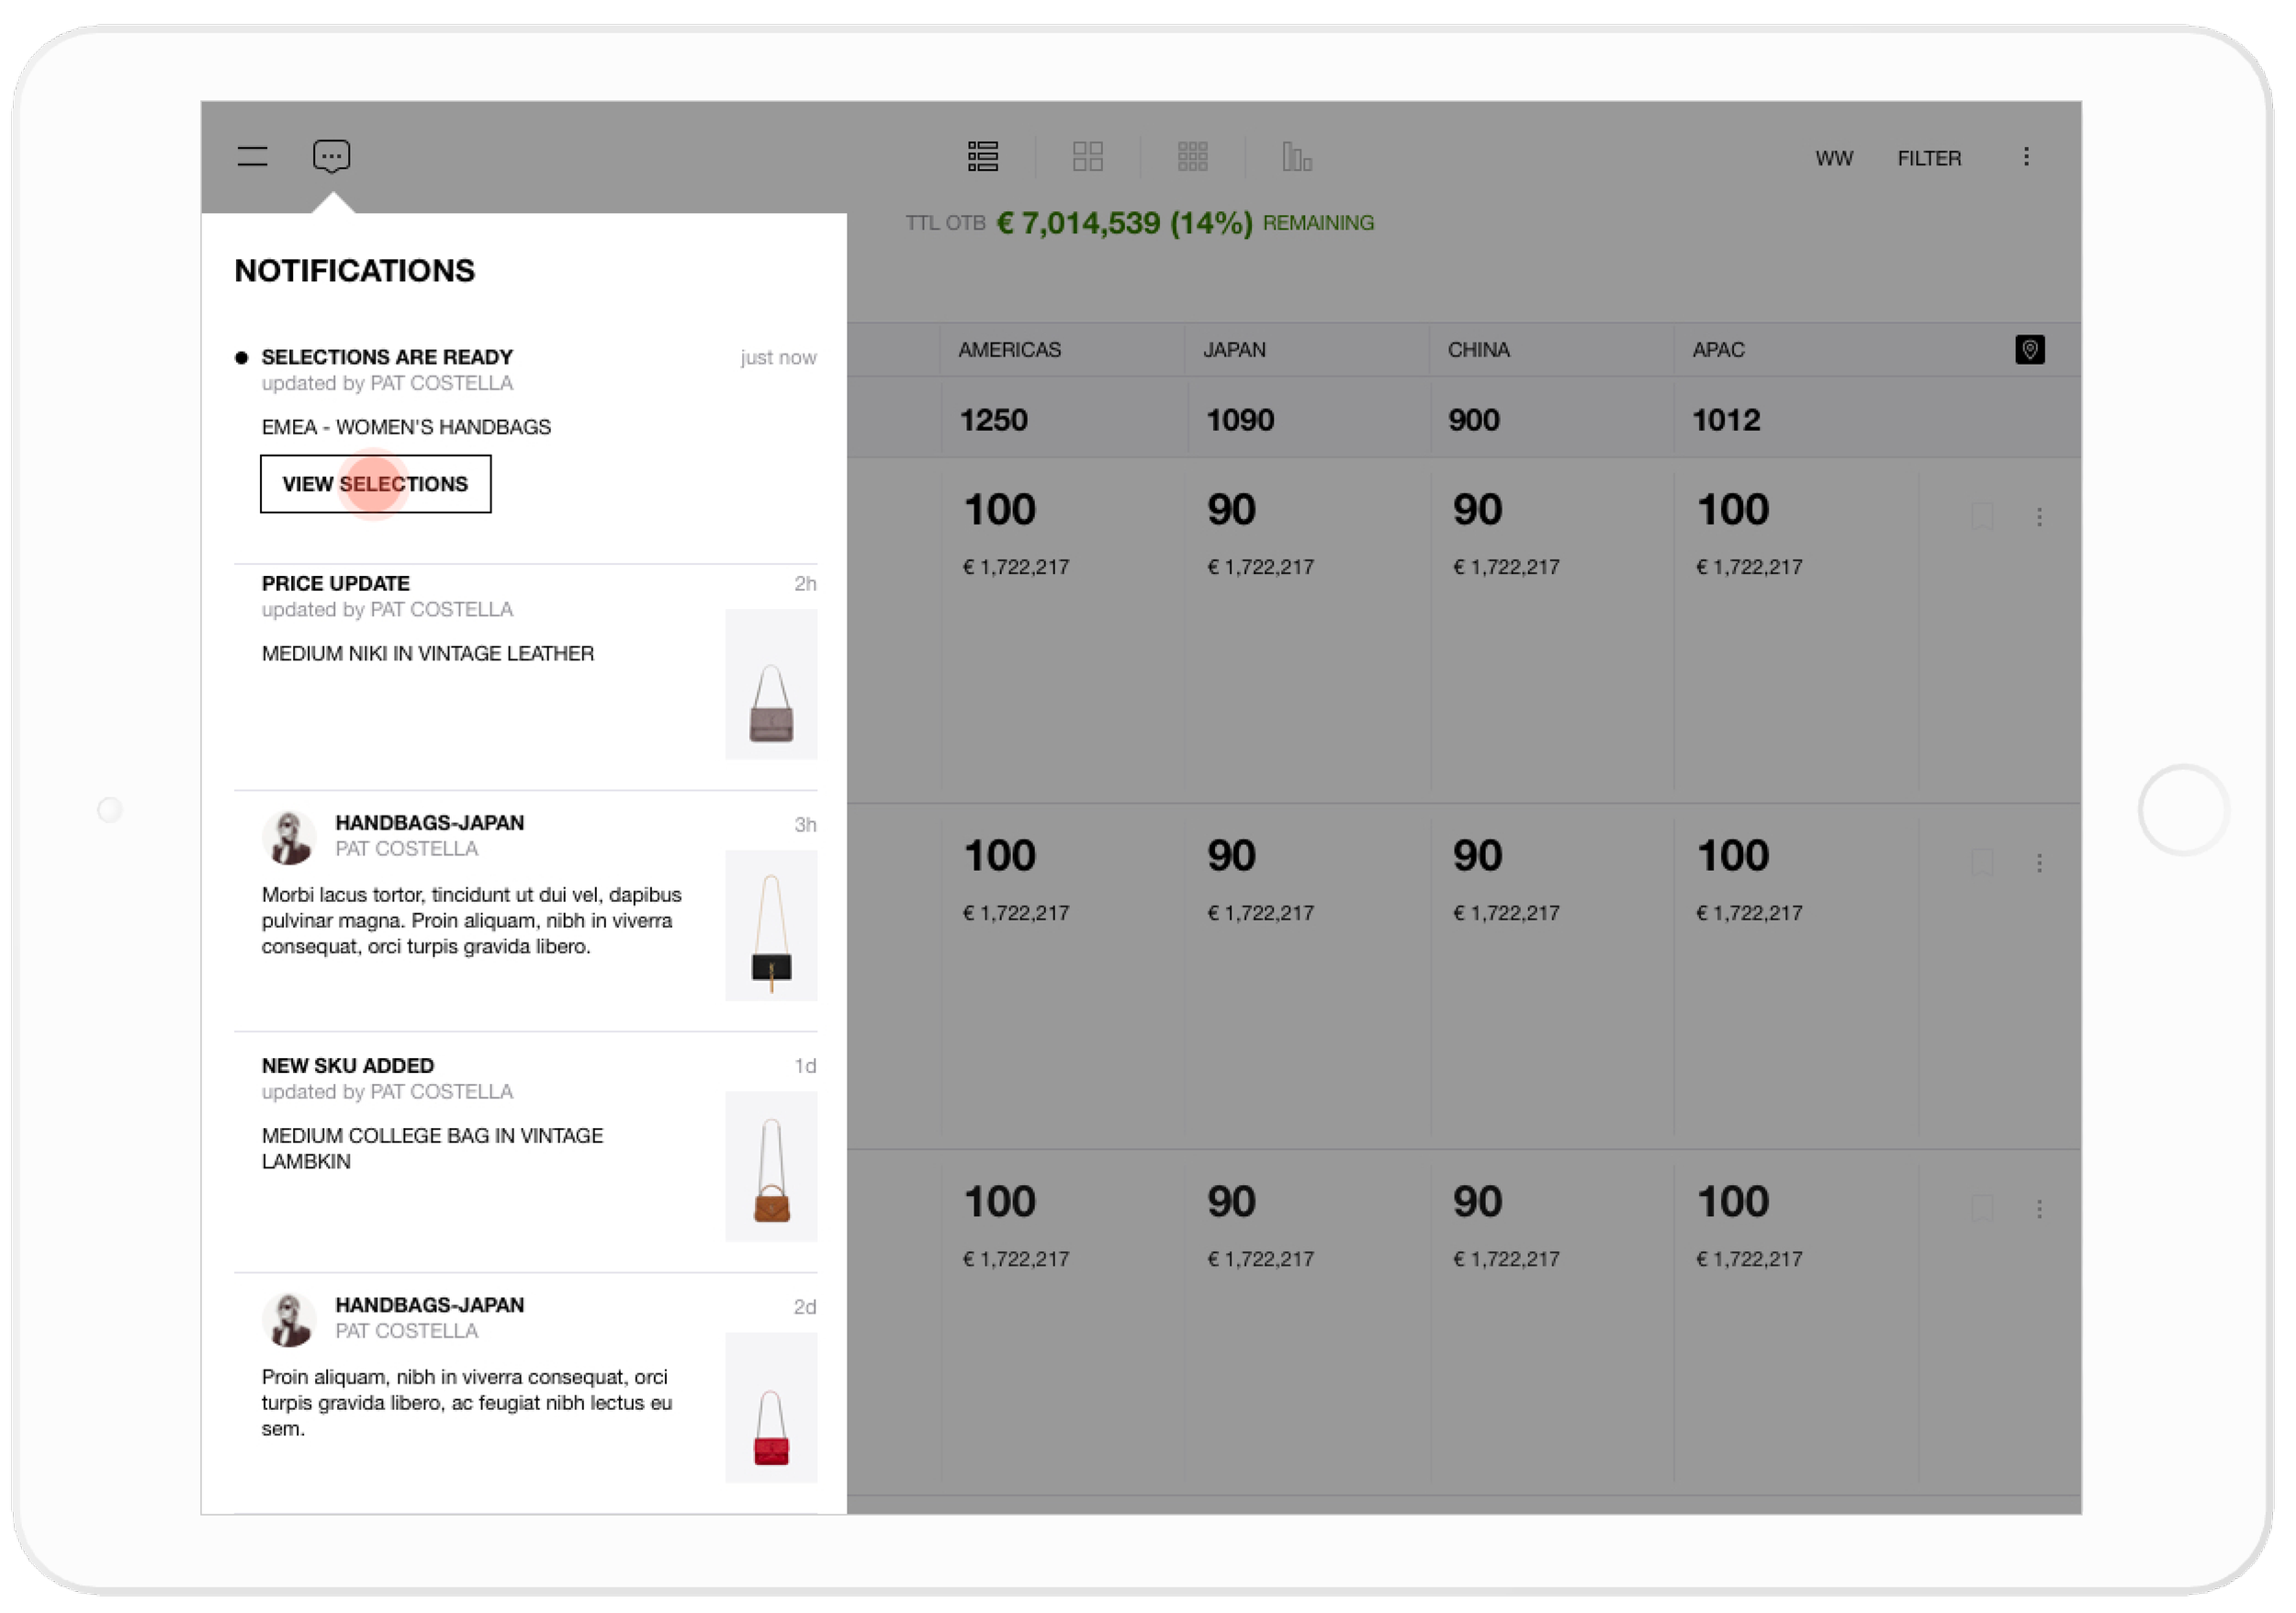
To enable transparent communication, we designed each product with a comments section. Merchandisers can notify buyers of changes, and buyers can negotiate with merchandisers and buyers from other regions by commenting on that product.
Negotiations and final quantities
Finalizing quantities currently requires printing Excel sheets with over 1,000 products and meeting with stakeholders. In these meetings, merchandisers and buyers review and finalize quantities, annotate the printed sheets with decisions, and then buyers manually update their Excel files.
With the new platform, buyers can submit quantities at any time, and merchandisers can review them directly within the system. Printing Excel sheets is no longer necessary, as participants can leave comments and update quantities in real time.
Results
Platform designed and shipped in 3 months
100% of required products rated; 23% with comments
Negotiation time reduced 67%: 30 hrs → 10 hrs
Debrief creation time reduced 83%: 12 hrs → 2 hrs
Explore more projects