9h0m
Manual work per pricing cycle
I led the strategy, design, and build of a merchandising tool that replaced a nine-hour spreadsheet process with automated daily price adjustments. Five of seven pricing zones now publish automatically every weekday, eliminating manual work per pricing cycle and helping increase monthly sell-through by 14% and promotional traffic by 33%.
With no dedicated product or engineering team, I owned the product end to end: identifying the opportunity, defining requirements and business rules, designing the experience, and building and shipping the tool. I worked directly with the founders and merchandiser, using Claude and Cursor as development partners.
9h0m
Manual work per pricing cycle
+14%
Monthly sell-through
+33%
Promotional traffic
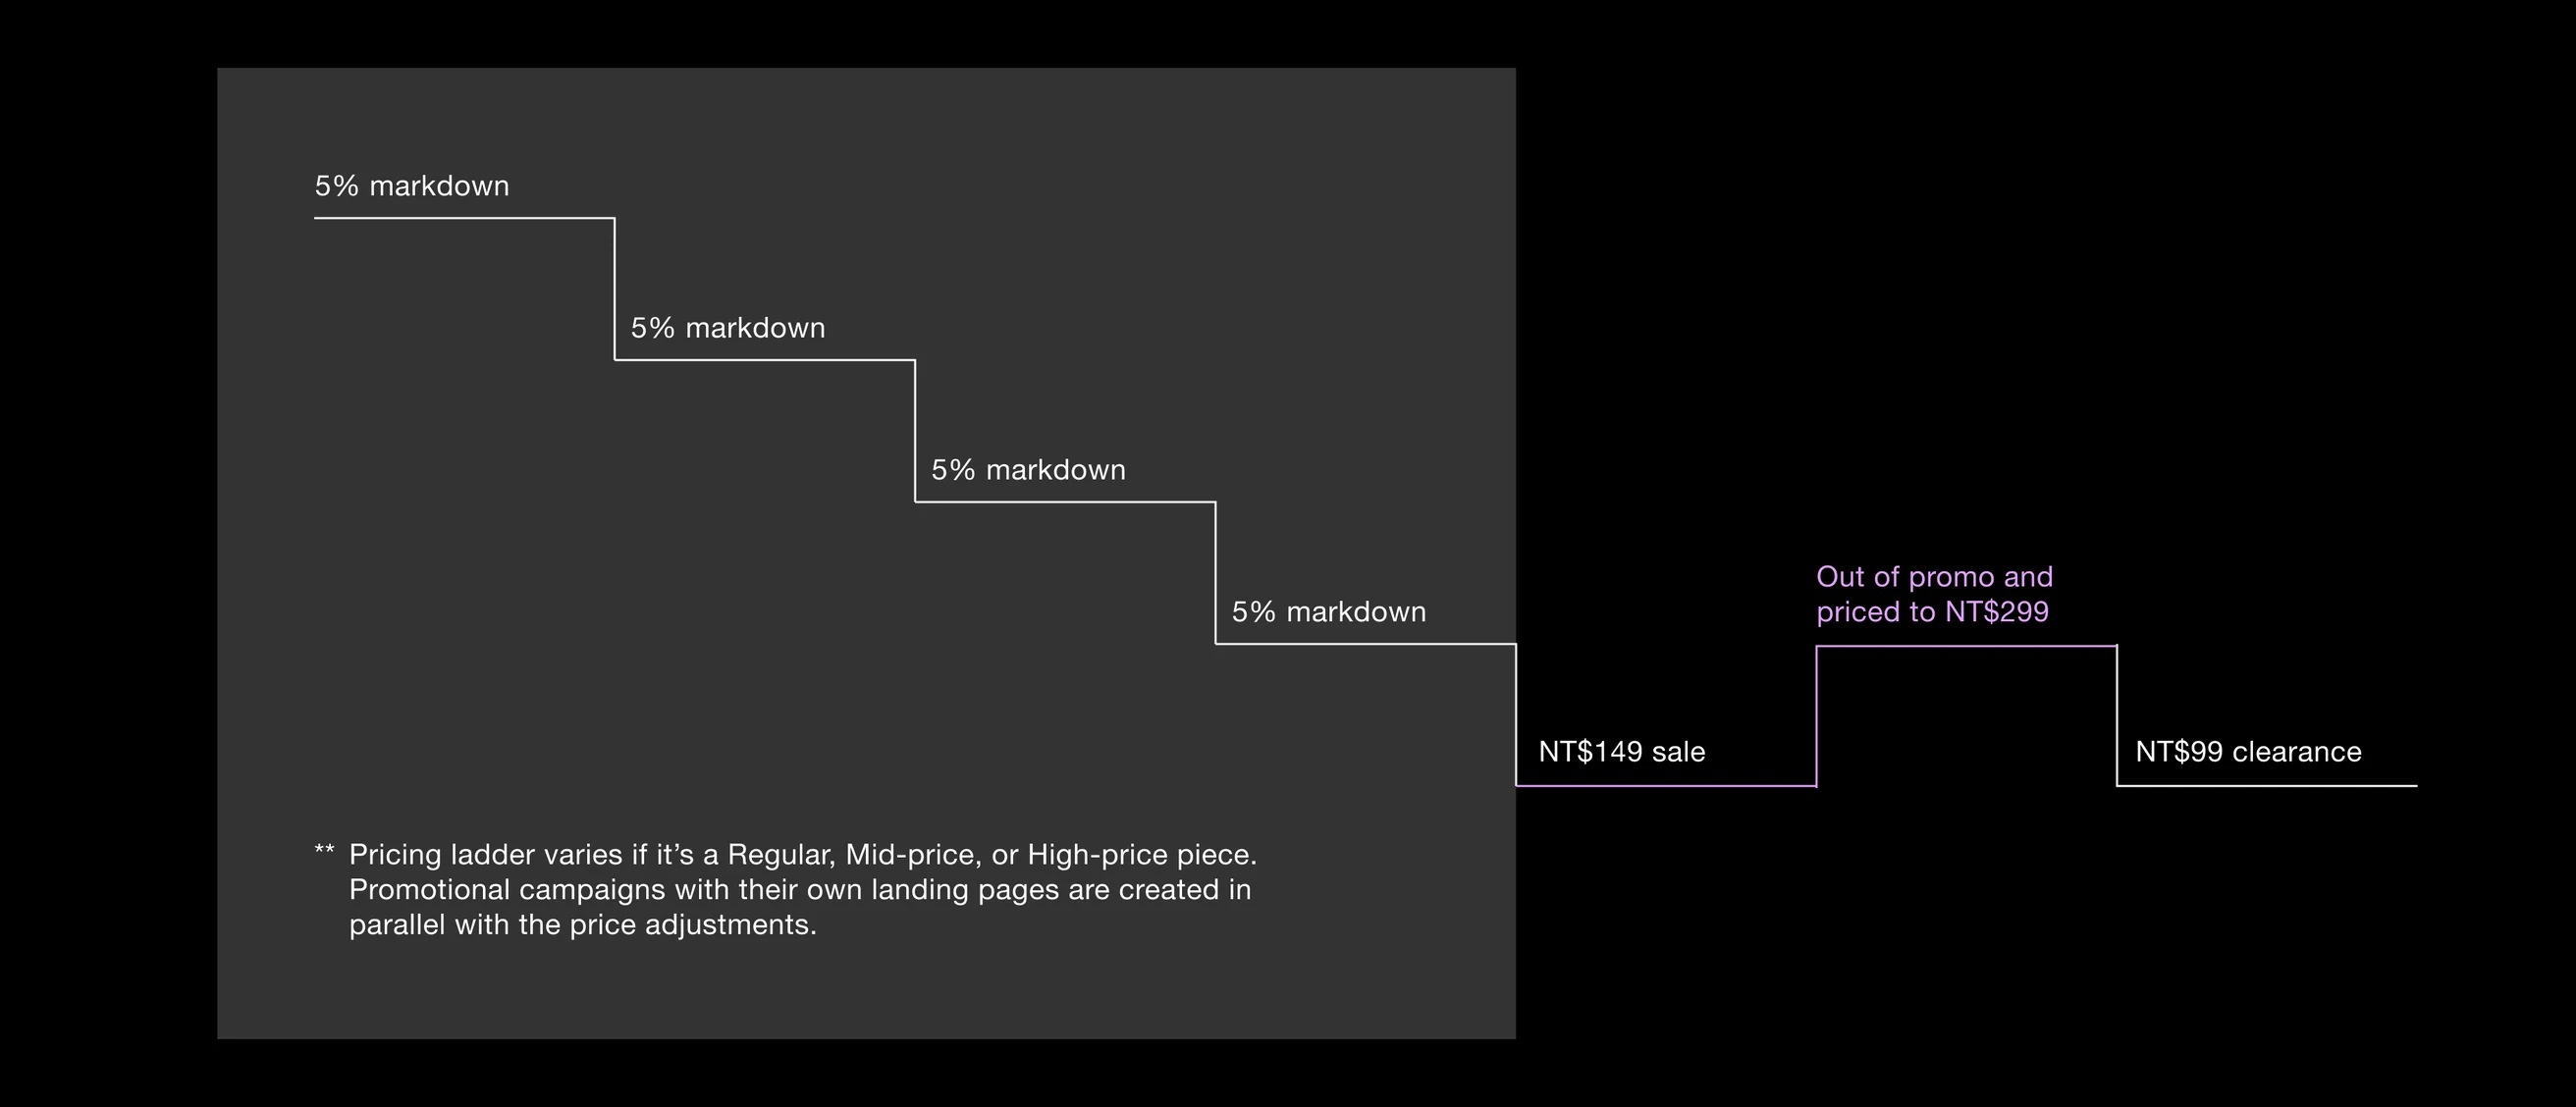
Because each item is one of a kind and cannot be restocked, the merchandising strategy is to lower prices over time and promote unsold items to new shoppers.
Swipe to see the full image →
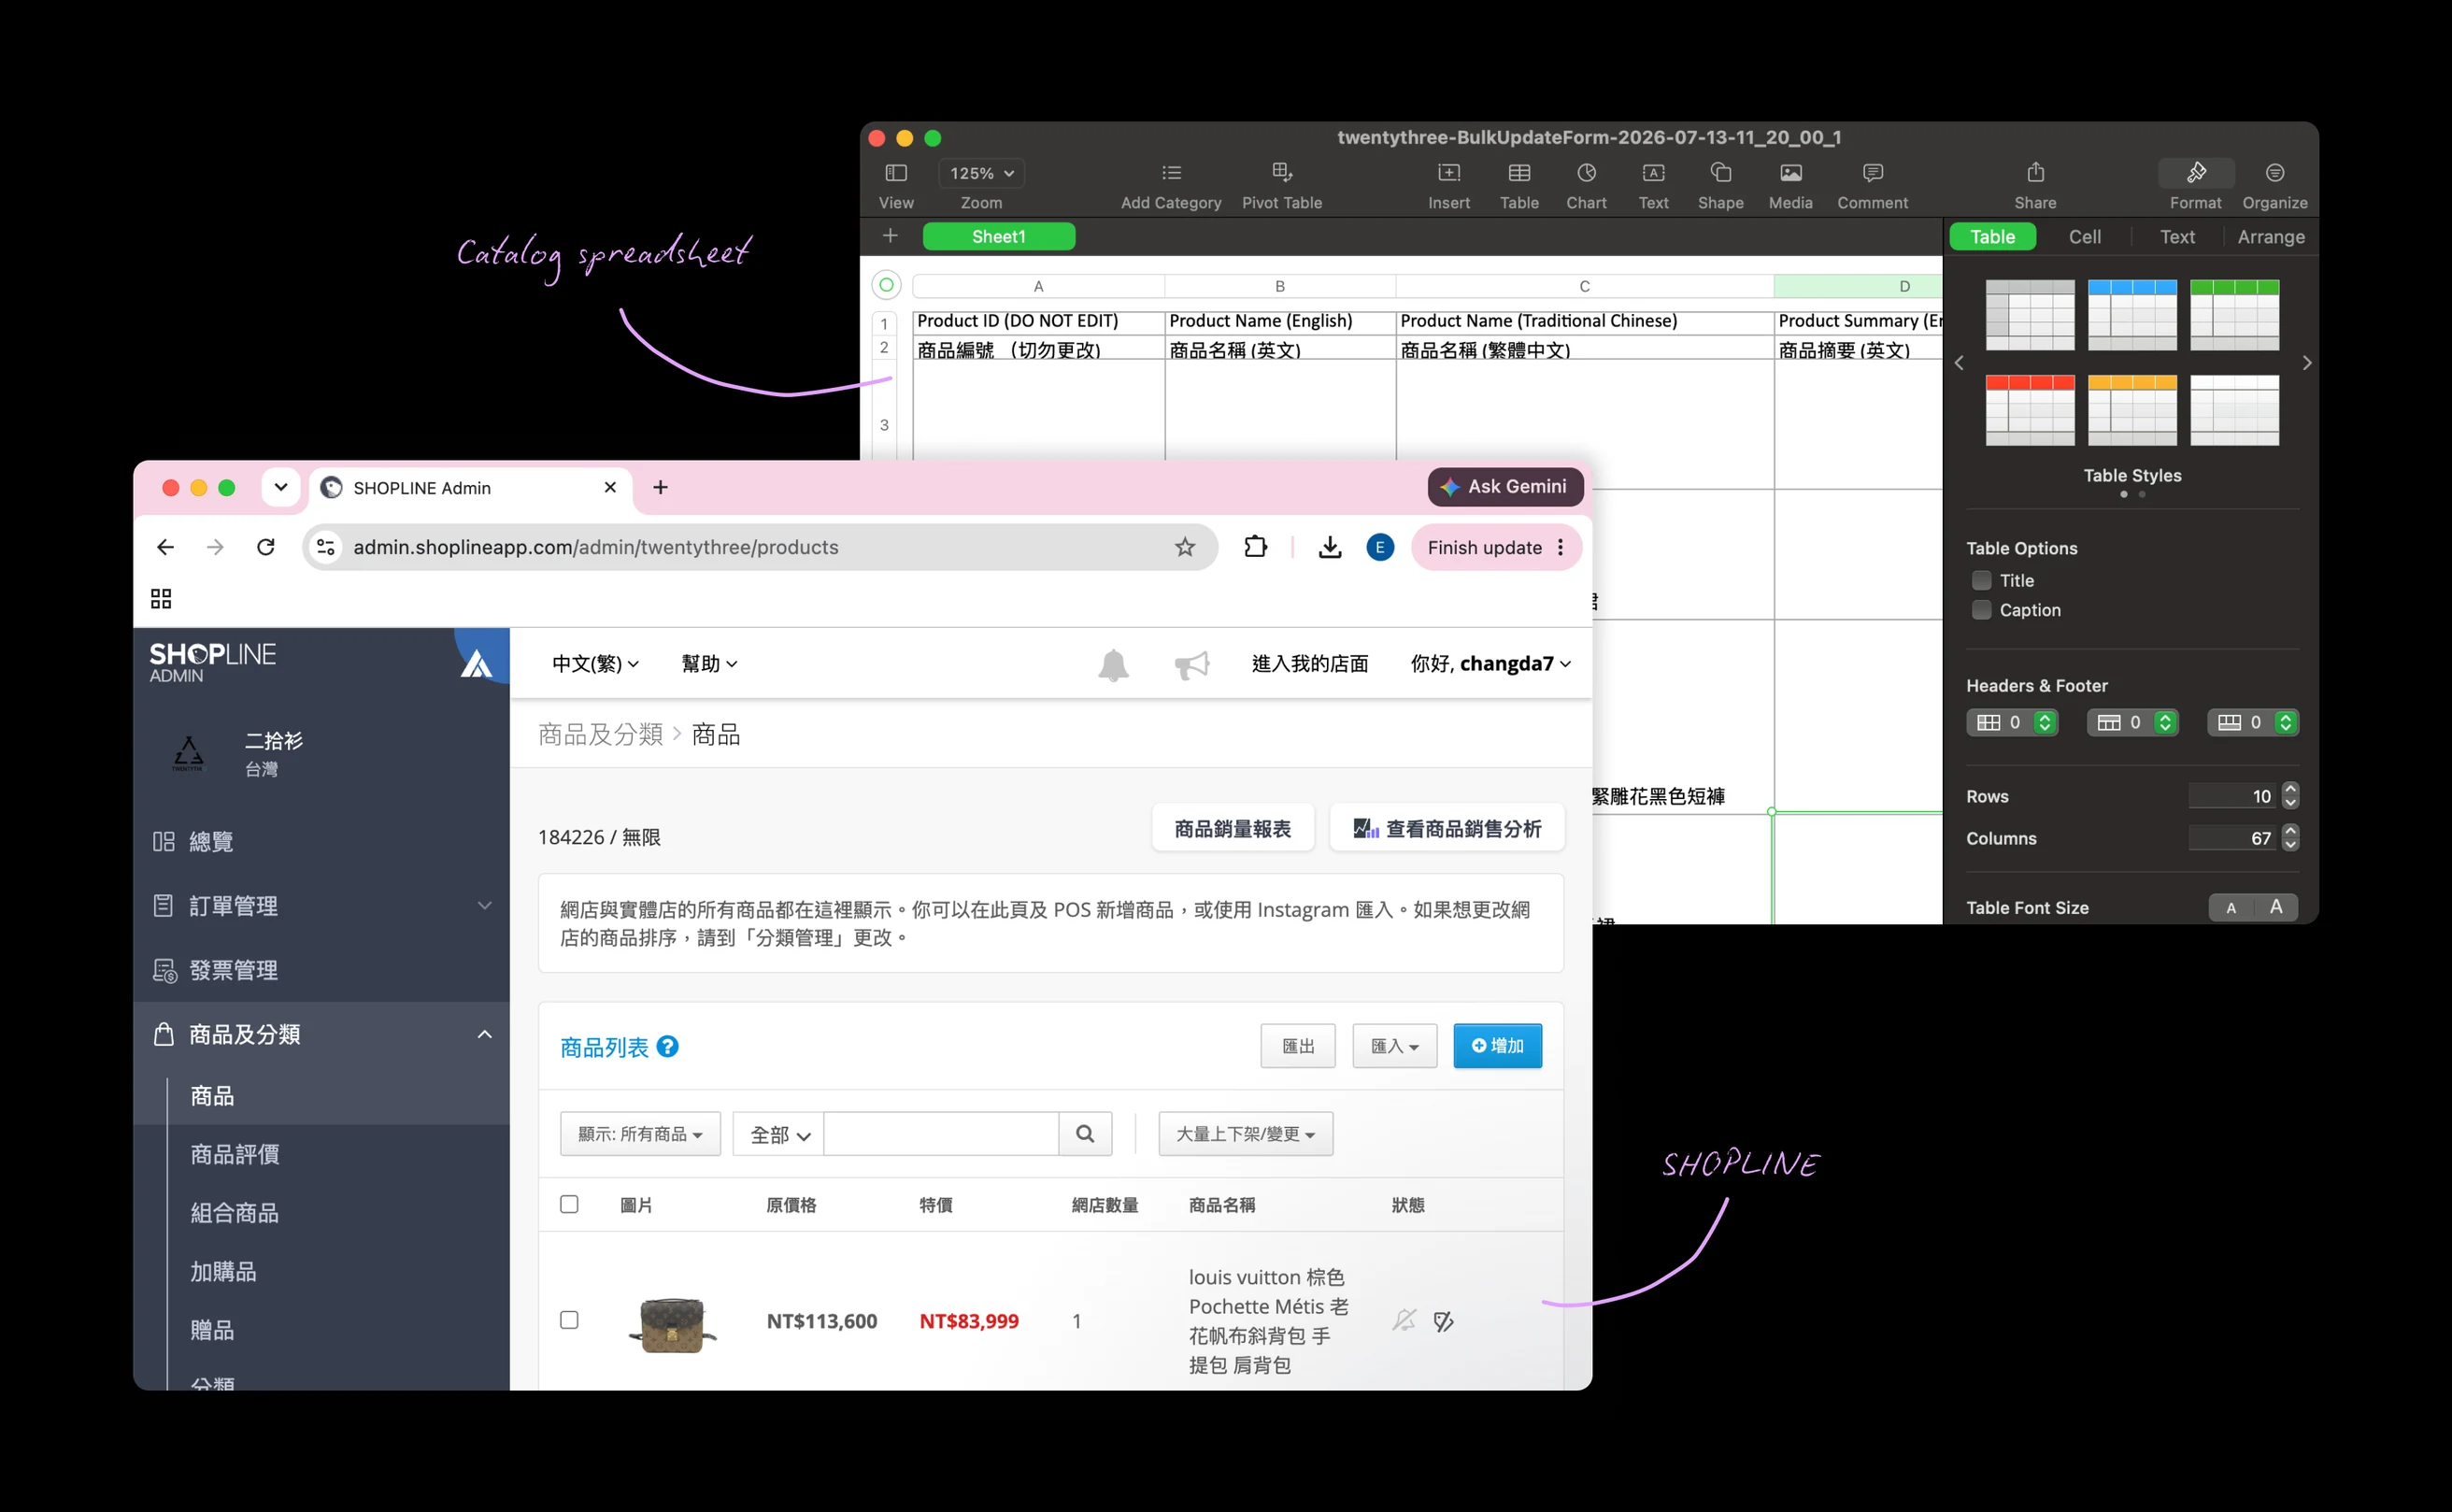
For each pricing cycle, the merchandiser had to download the full catalog from SHOPLINE, find the products due for a price change, update prices and promotional zones one by one, and upload the spreadsheet again. Uploads frequently failed, creating more manual work to find and fix errors.
Swipe to see the full image →
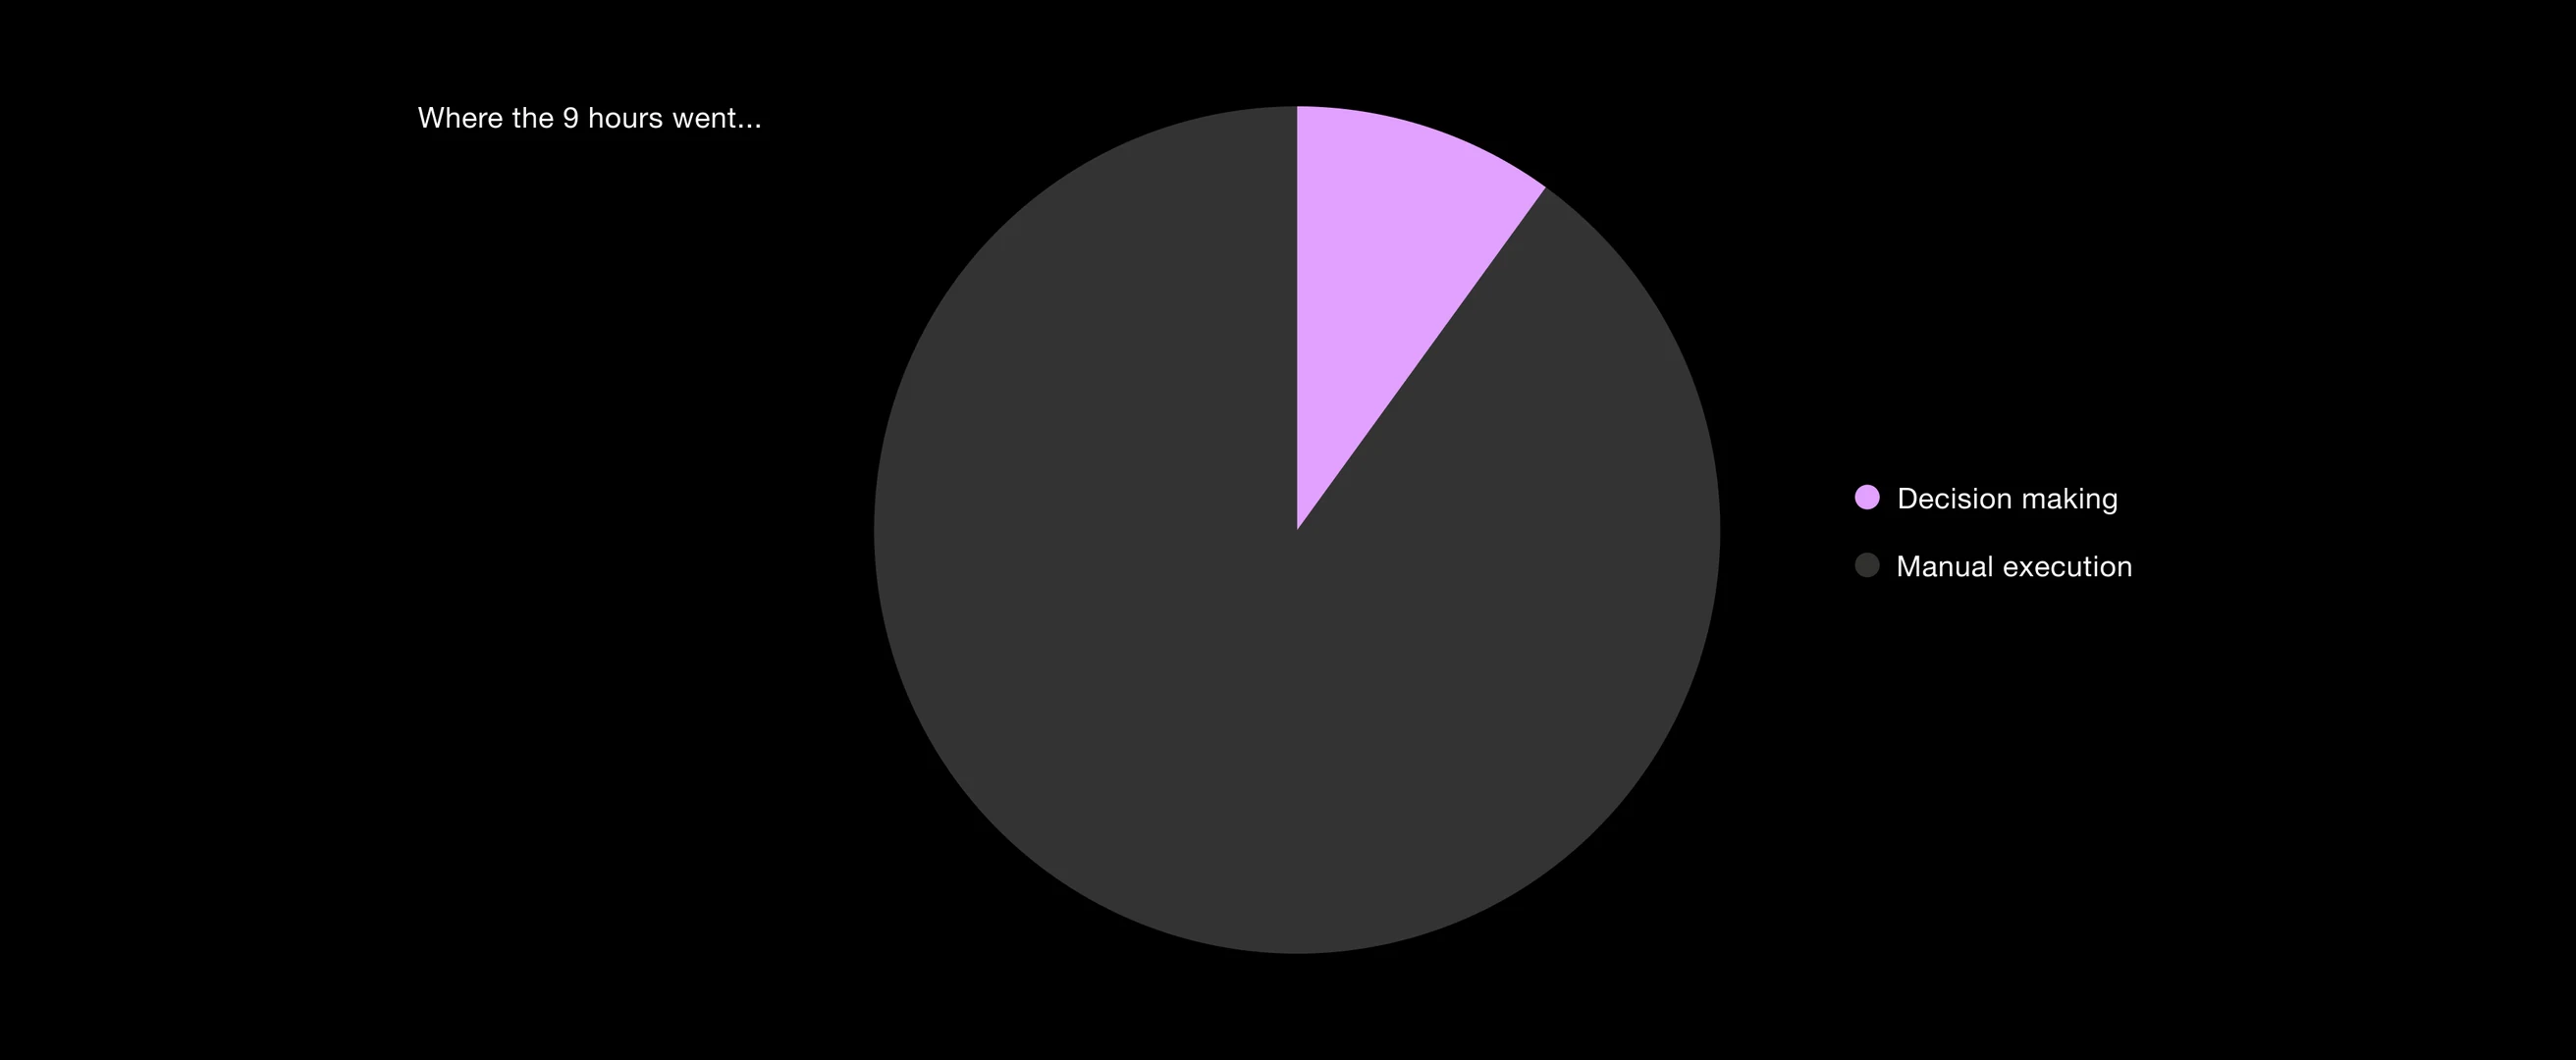
Interviews with the merchandiser revealed that most of the nine hours went toward manual work, not pricing decisions. Previous pricing cycles showed that more frequent markdowns increased monthly sell-through by 8%. Automating the repetitive work would let the team adjust prices more often without adding to the workload.
Swipe to see the full image →
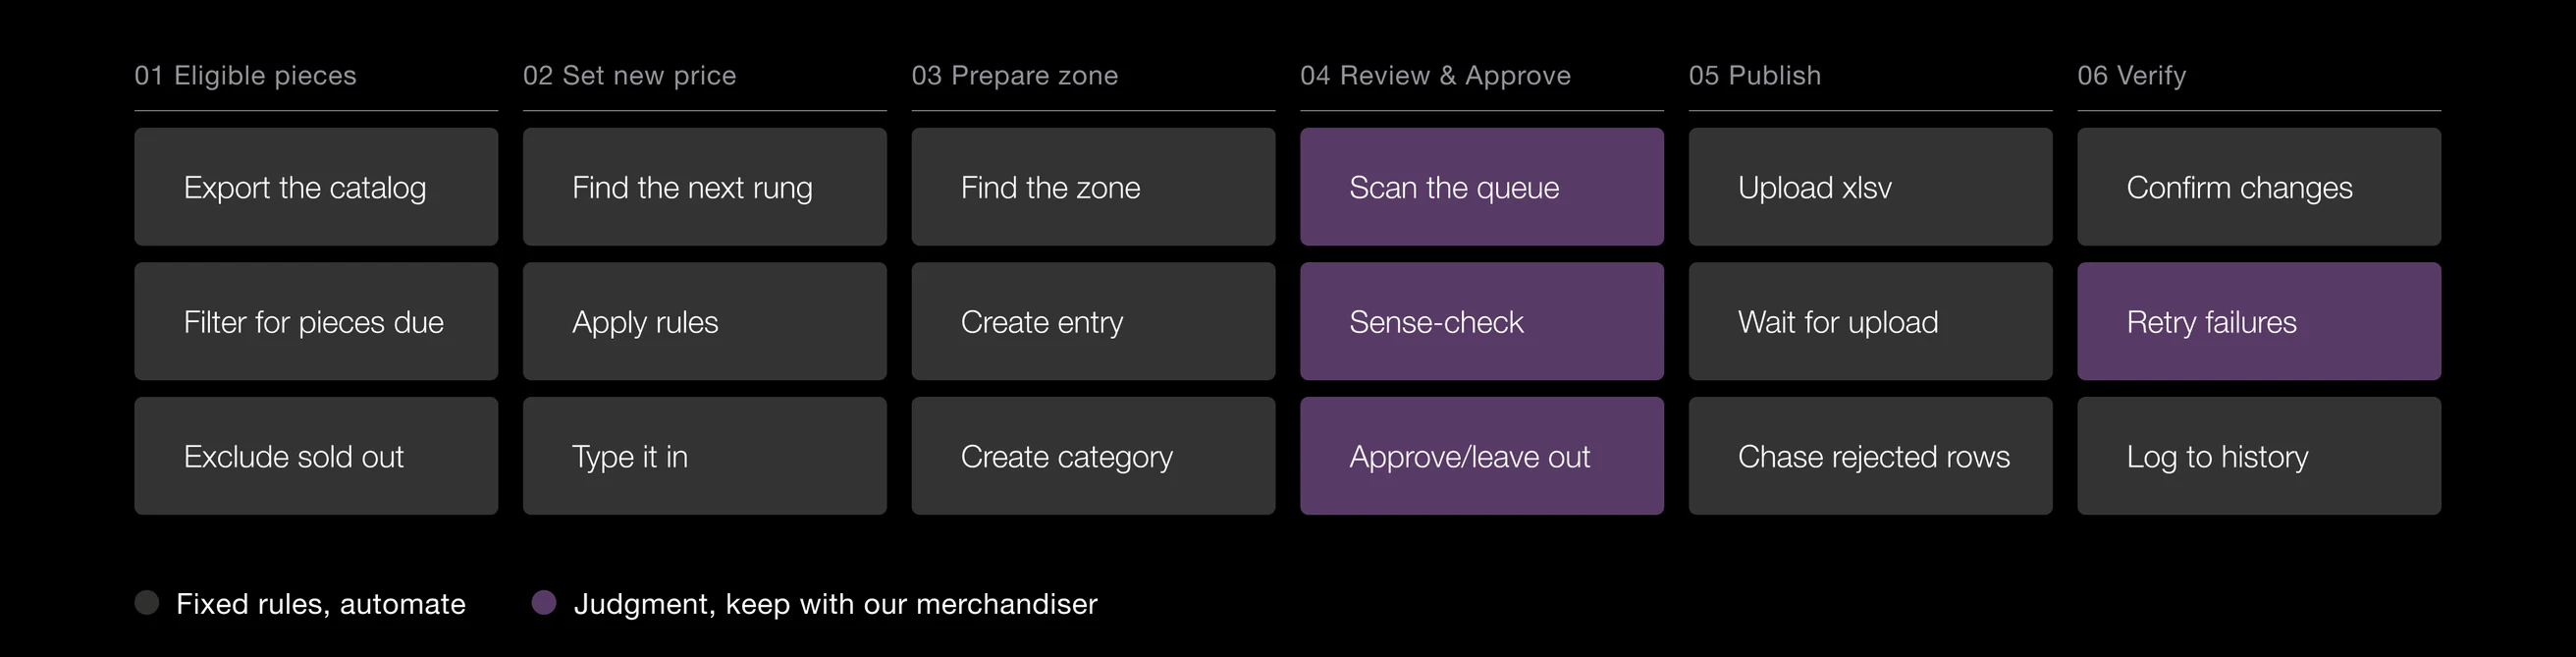
I mapped the full pricing process, from identifying eligible products to verifying published changes. This helped align the team on what the tool could handle automatically and where the merchandiser needed to stay in control. The tool would handle fixed rules and repetitive tasks. The merchandiser would still review proposed changes, check for exceptions, and decide which products to approve or skip.
Swipe to see the full image →
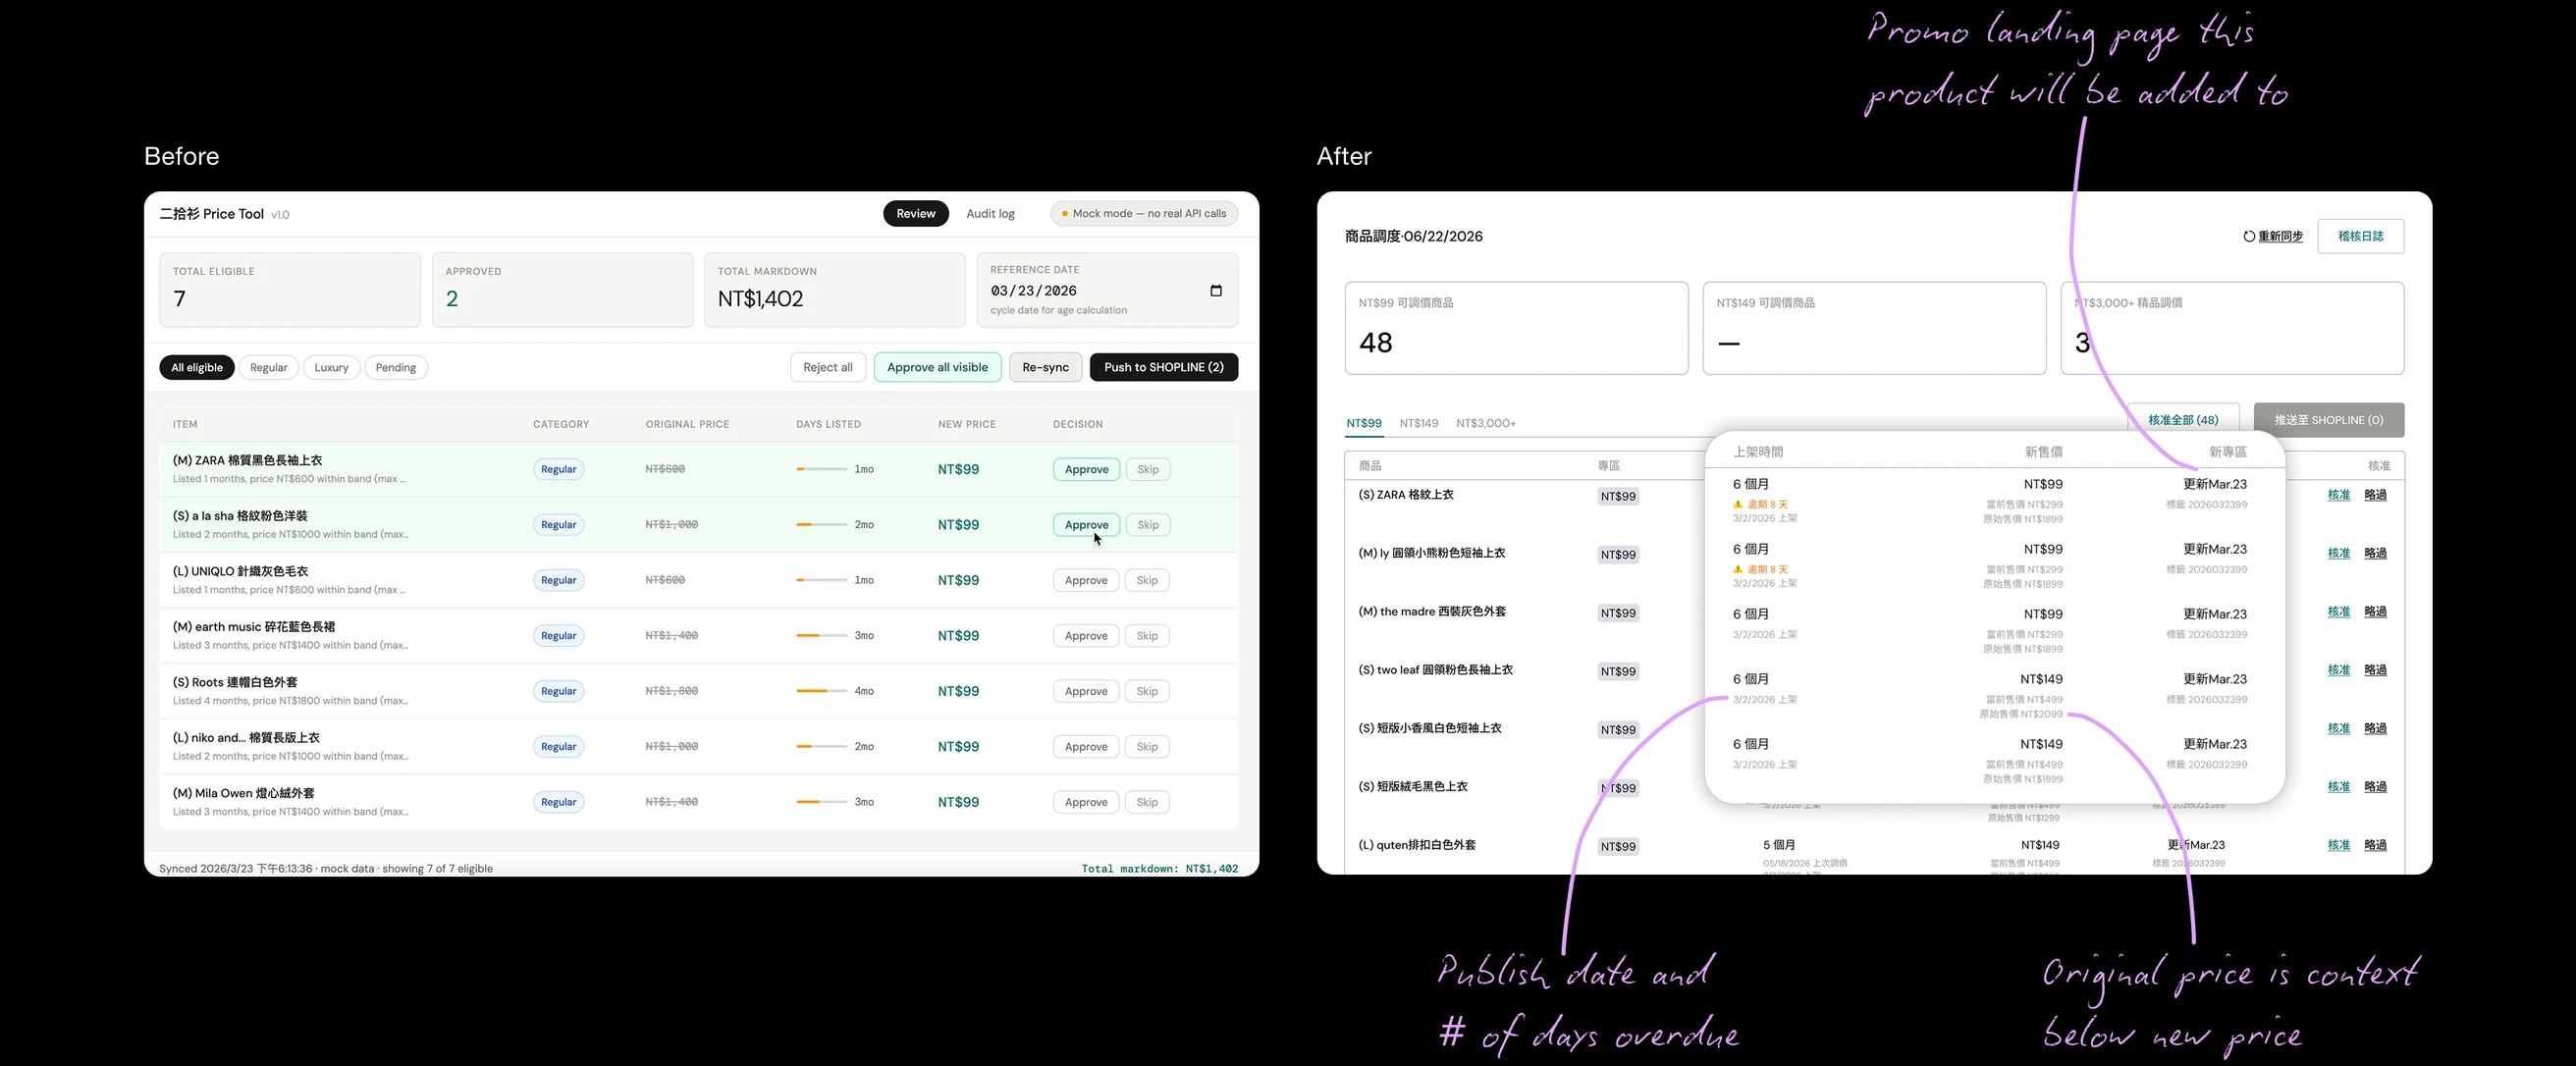
The prototype showed eligible products and their proposed price changes in one place. The merchandiser could approve or skip each item before anything was published. This gave us a concrete way to test the workflow with the person doing the job before investing in a more complete tool.
Testing with the merchandiser helped me improve how products, pricing zones, and progress were presented.
Easier product comparisons
I brought the publish date, original price, proposed price, and promotional zone together so the merchandiser could quickly check each product without switching between columns or views.
Swipe to see the full image →
Clearer next steps
Promotional zones only accept products during specific date ranges. I made the zone cards show which zones needed attention that day and when inactive zones would open next.

Swipe to see the full image →
Simpler pricing rules
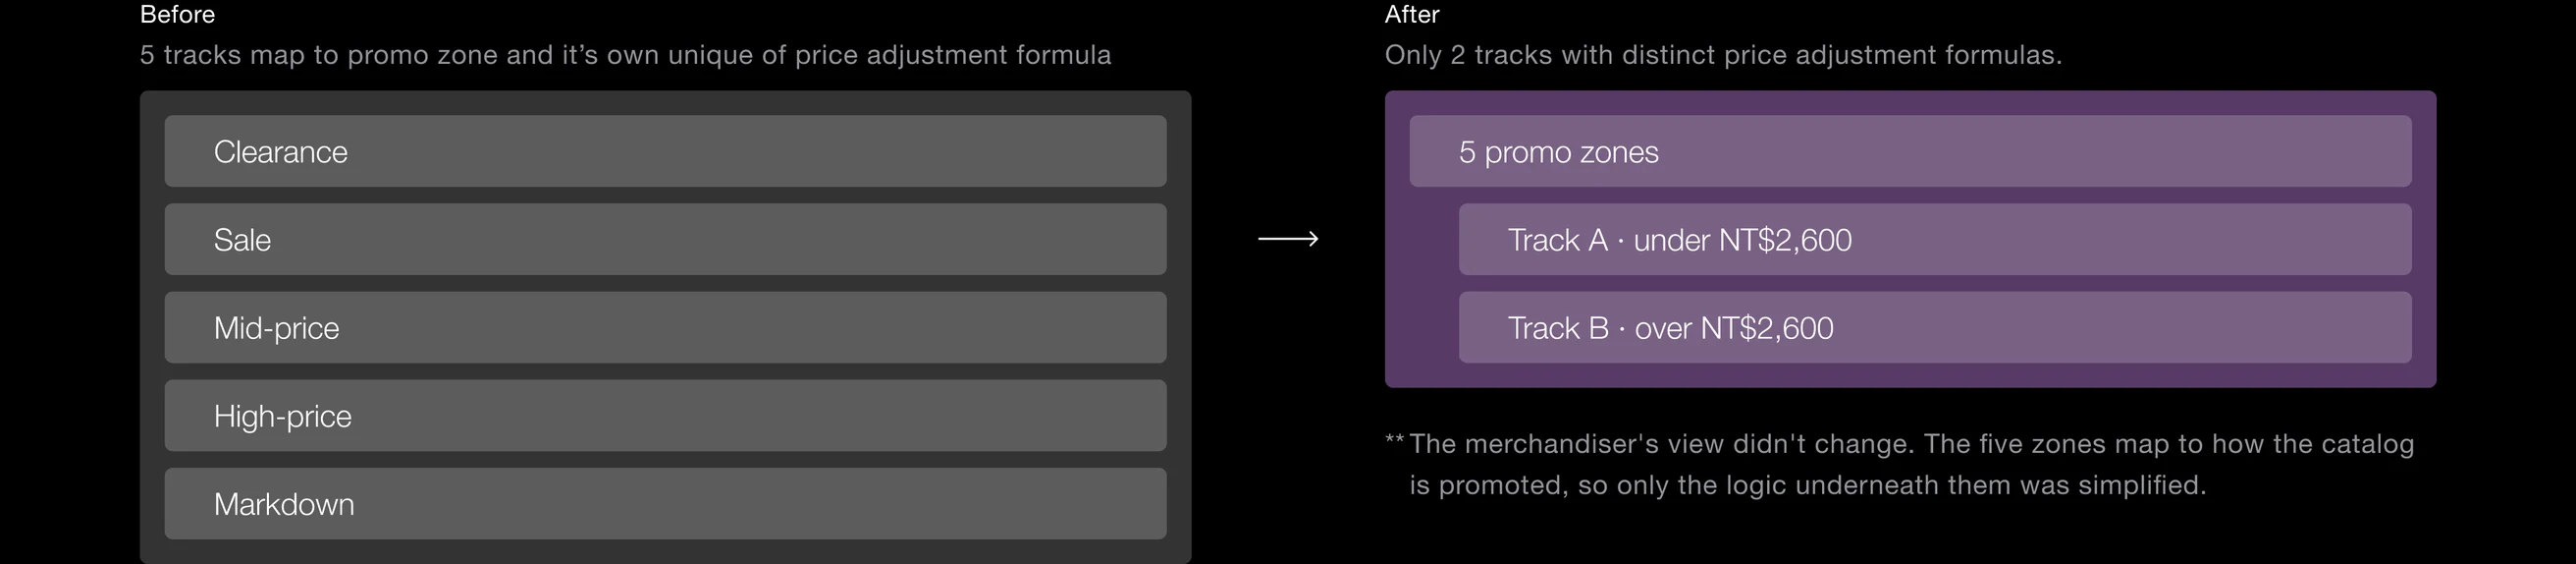
As the strategy grew from two pricing zones to five, the underlying pricing logic became harder to manage. I showed the founder how the added rules increased edge cases and pricing risk without a clear benefit. We simplified the logic from five pricing tracks to two while keeping all five promotional zones.
Swipe to see the full image →
Visible progress
I added progress against the planned monthly total so the merchandiser could see how many products had been adjusted and whether the team was on track.

Swipe to see the full image →
This was the final manual version of the merchandising tool.
The review tool worked reliably for months, but every price change still required the merchandiser’s approval. When she was out of office, someone else had to take over. The original request was for a scheduler that would let her queue changes in advance. But that would still require someone to plan and approve every update.
I proposed automating when price changes were published, while keeping the pricing rules unchanged. The system would follow the same rules as the manual process. Decisions with business implications, like taking a product off sale, would remain with the team.
Five of seven pricing zones now publish automatically every weekday at 4 PM. I rolled out automation one zone at a time, validating each full cycle before expanding. Real runs exposed gaps in how results were reported, so I designed the dashboard to clearly show expected versus completed updates, flag failures, and make retries easy. With no manual approval step, the dashboard became the team’s main way to verify that automation was working.
I designed the monitoring experience around three rules:
1
Show what happened
Put today’s expected and completed updates at the top.
2
Keep the target consistent
Set each zone’s expected count once a day so the team can see when a run falls short.
3
Make failures actionable
Highlight days that missed their target and give the team one place to retry failed products.
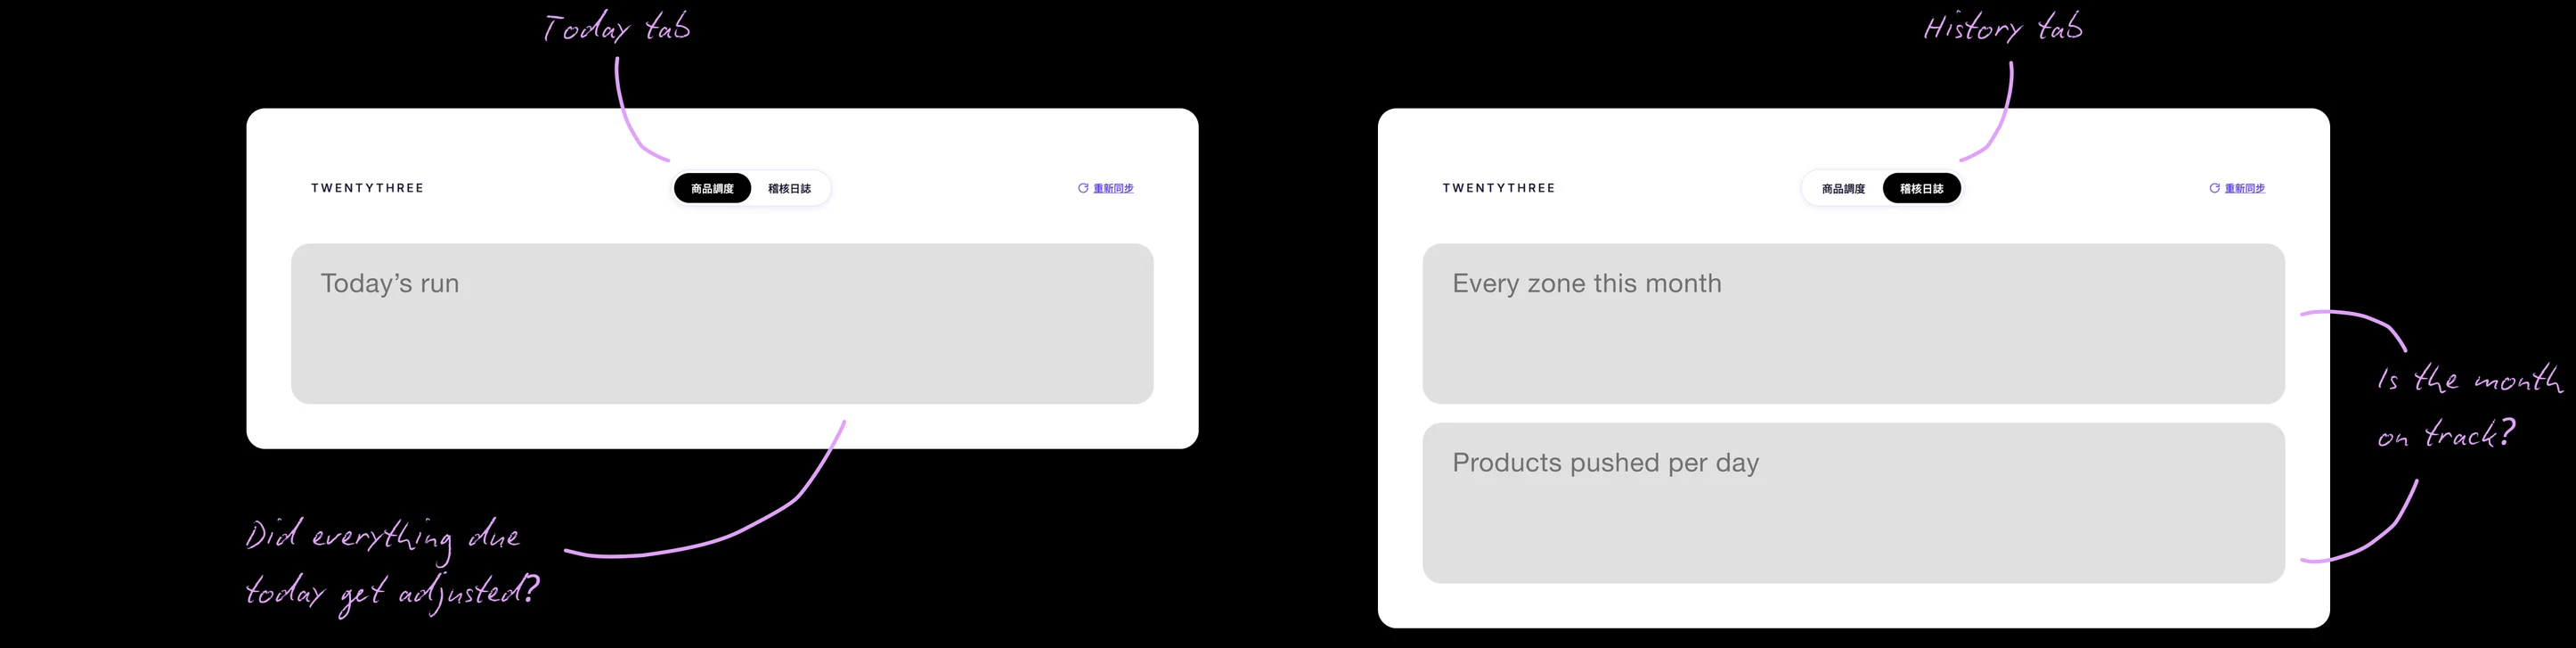
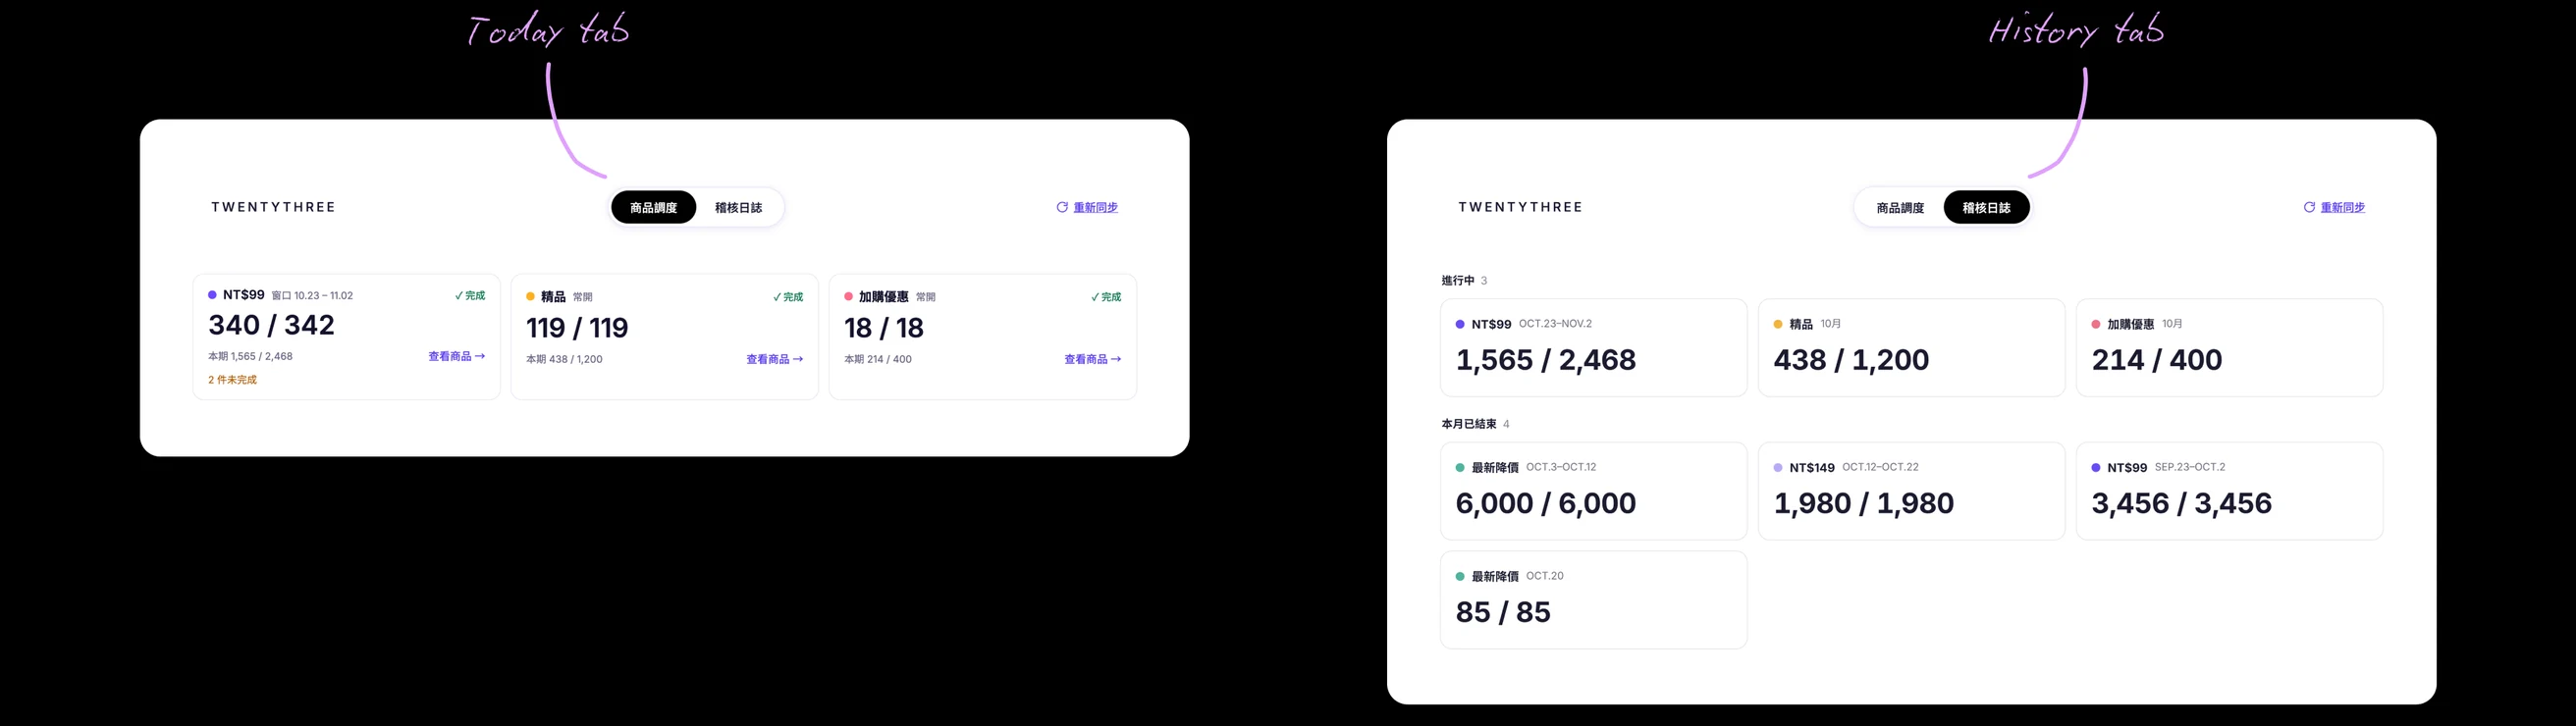
I started with the familiar structure of the manual tool: a Today view for checking the latest updates and a History view for reviewing past activity.
I explored each view separately, focusing on what information the team needed and how best to present it. For Today, I tested different layouts for showing the status of each pricing zone due for adjustments today. For History, I explored ways to show monthly progress and make individual days easy to inspect.
Swipe to see the full image →
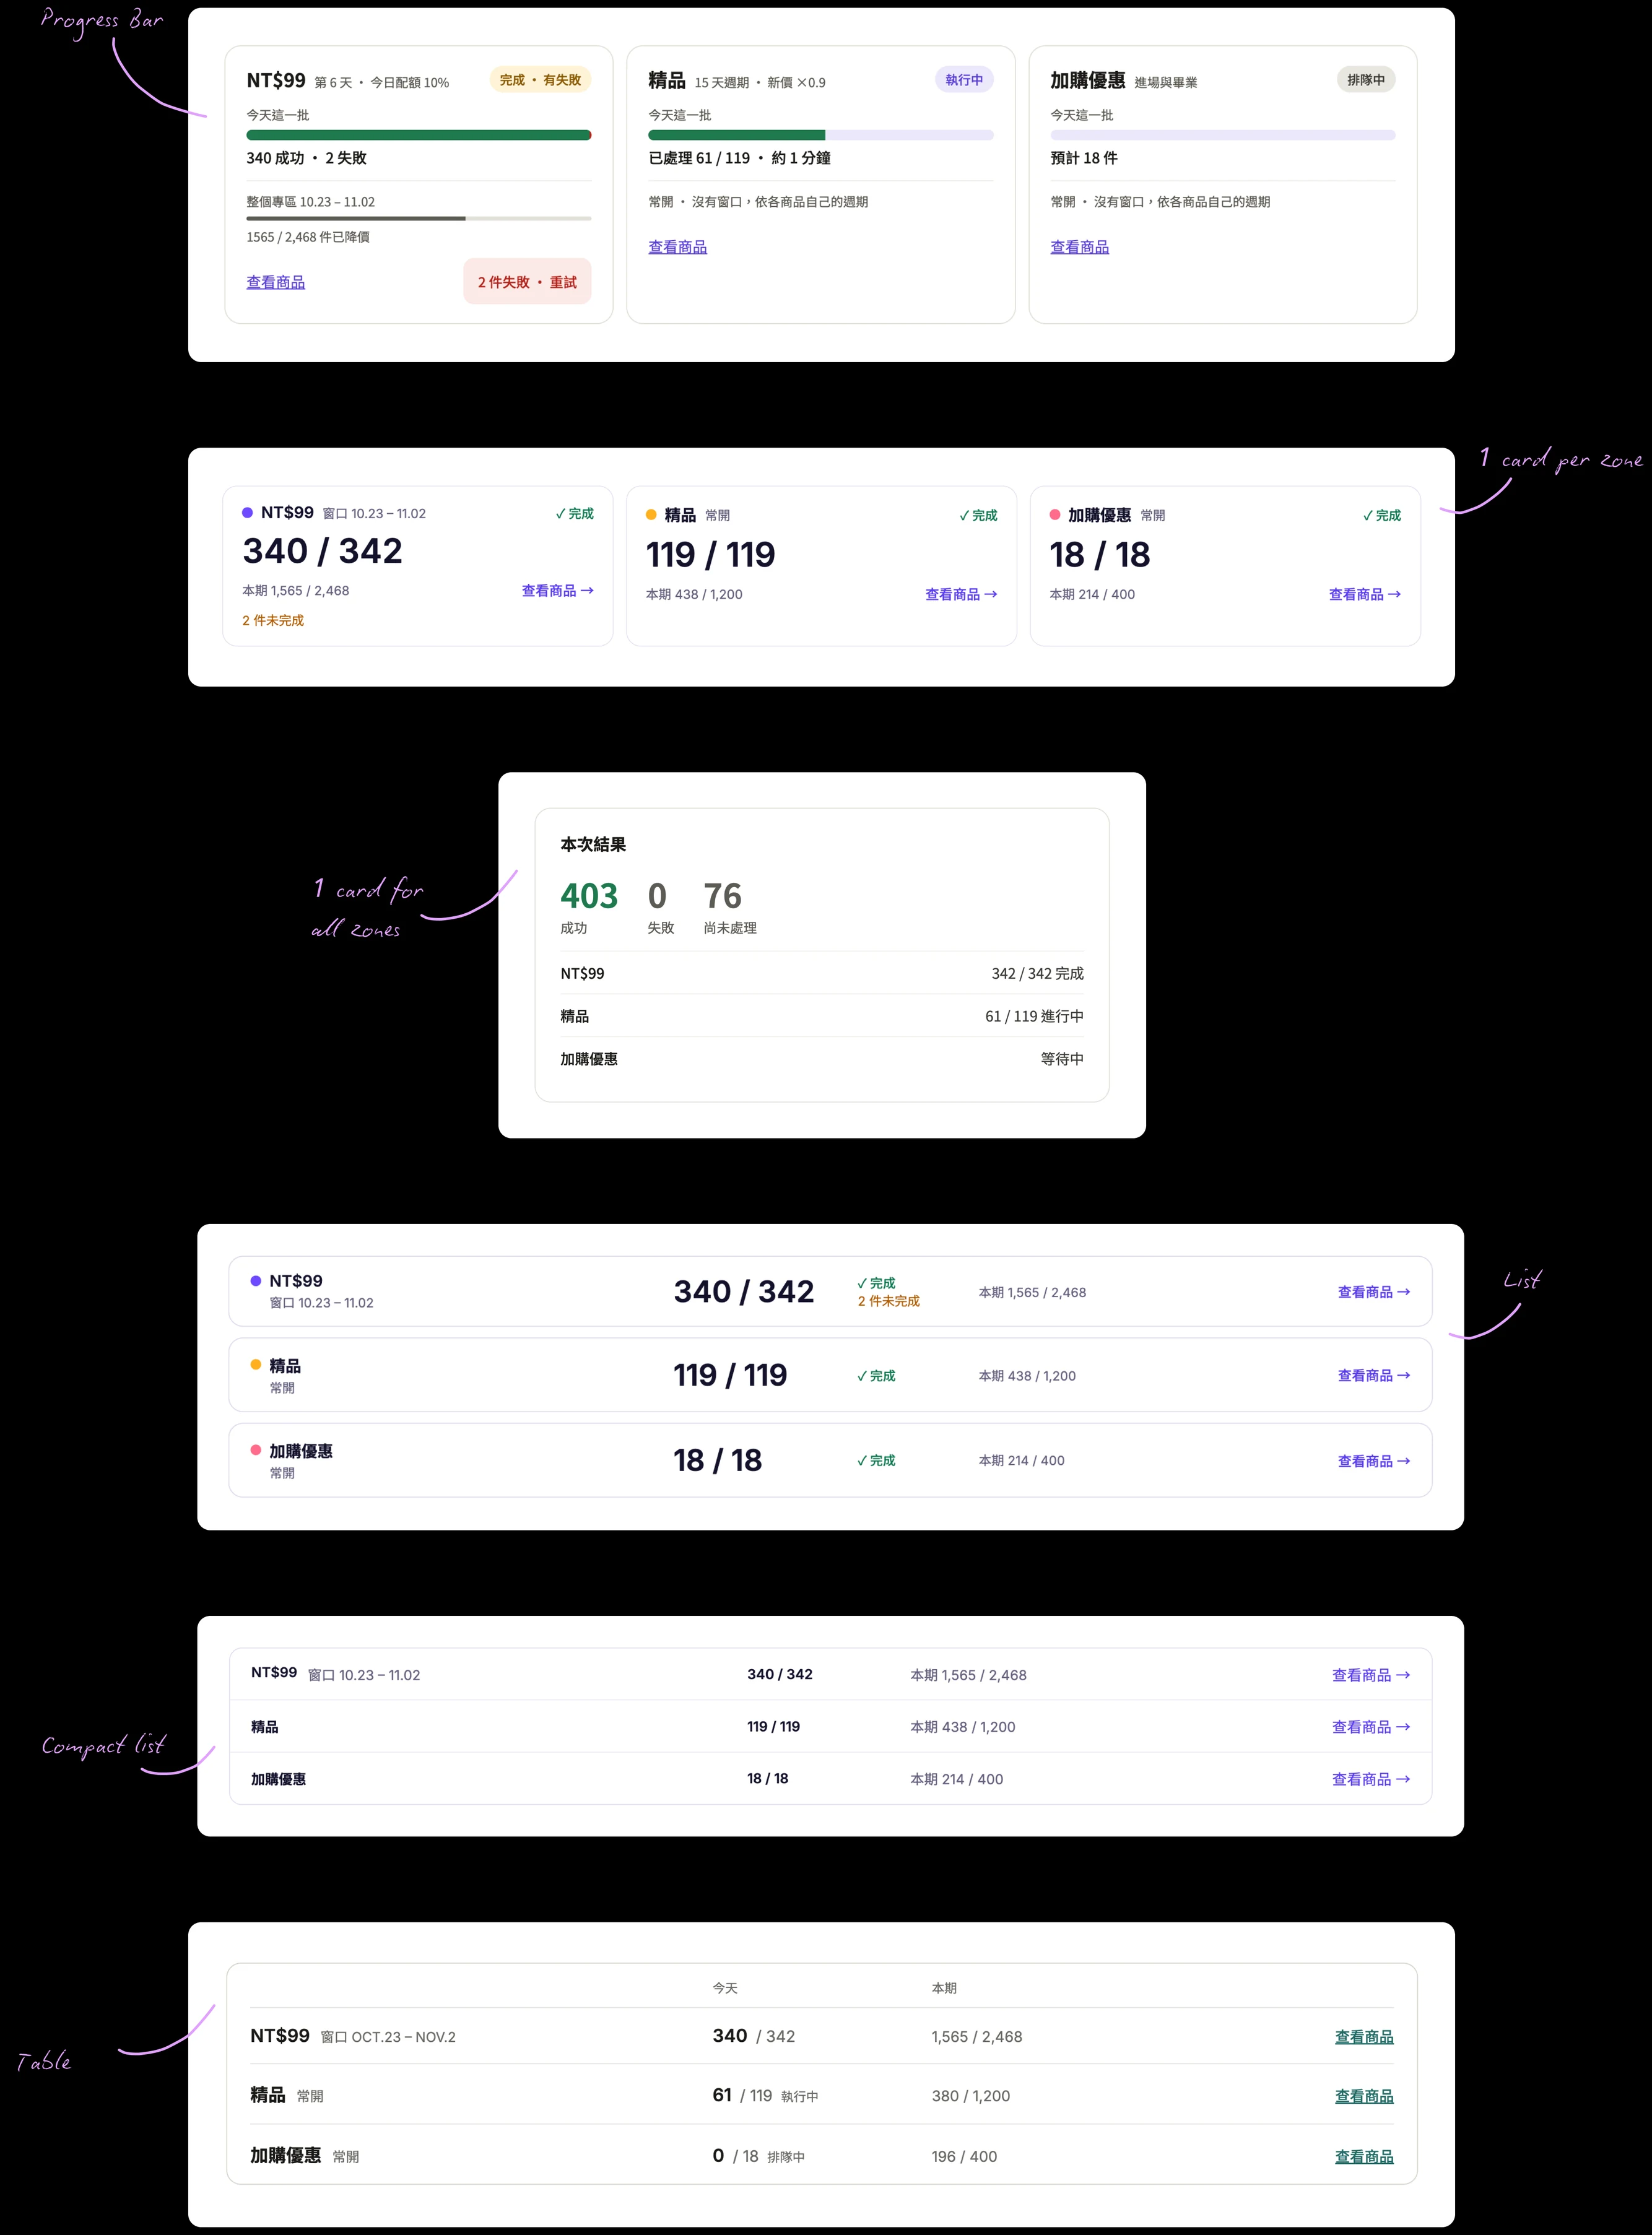
For today’s run, I tried cards for each zone, a combined results card, progress bars, lists, and a table. The main consideration was how quickly the merchandiser could see which zones needed attention and compare their results.
Swipe to see the full image →
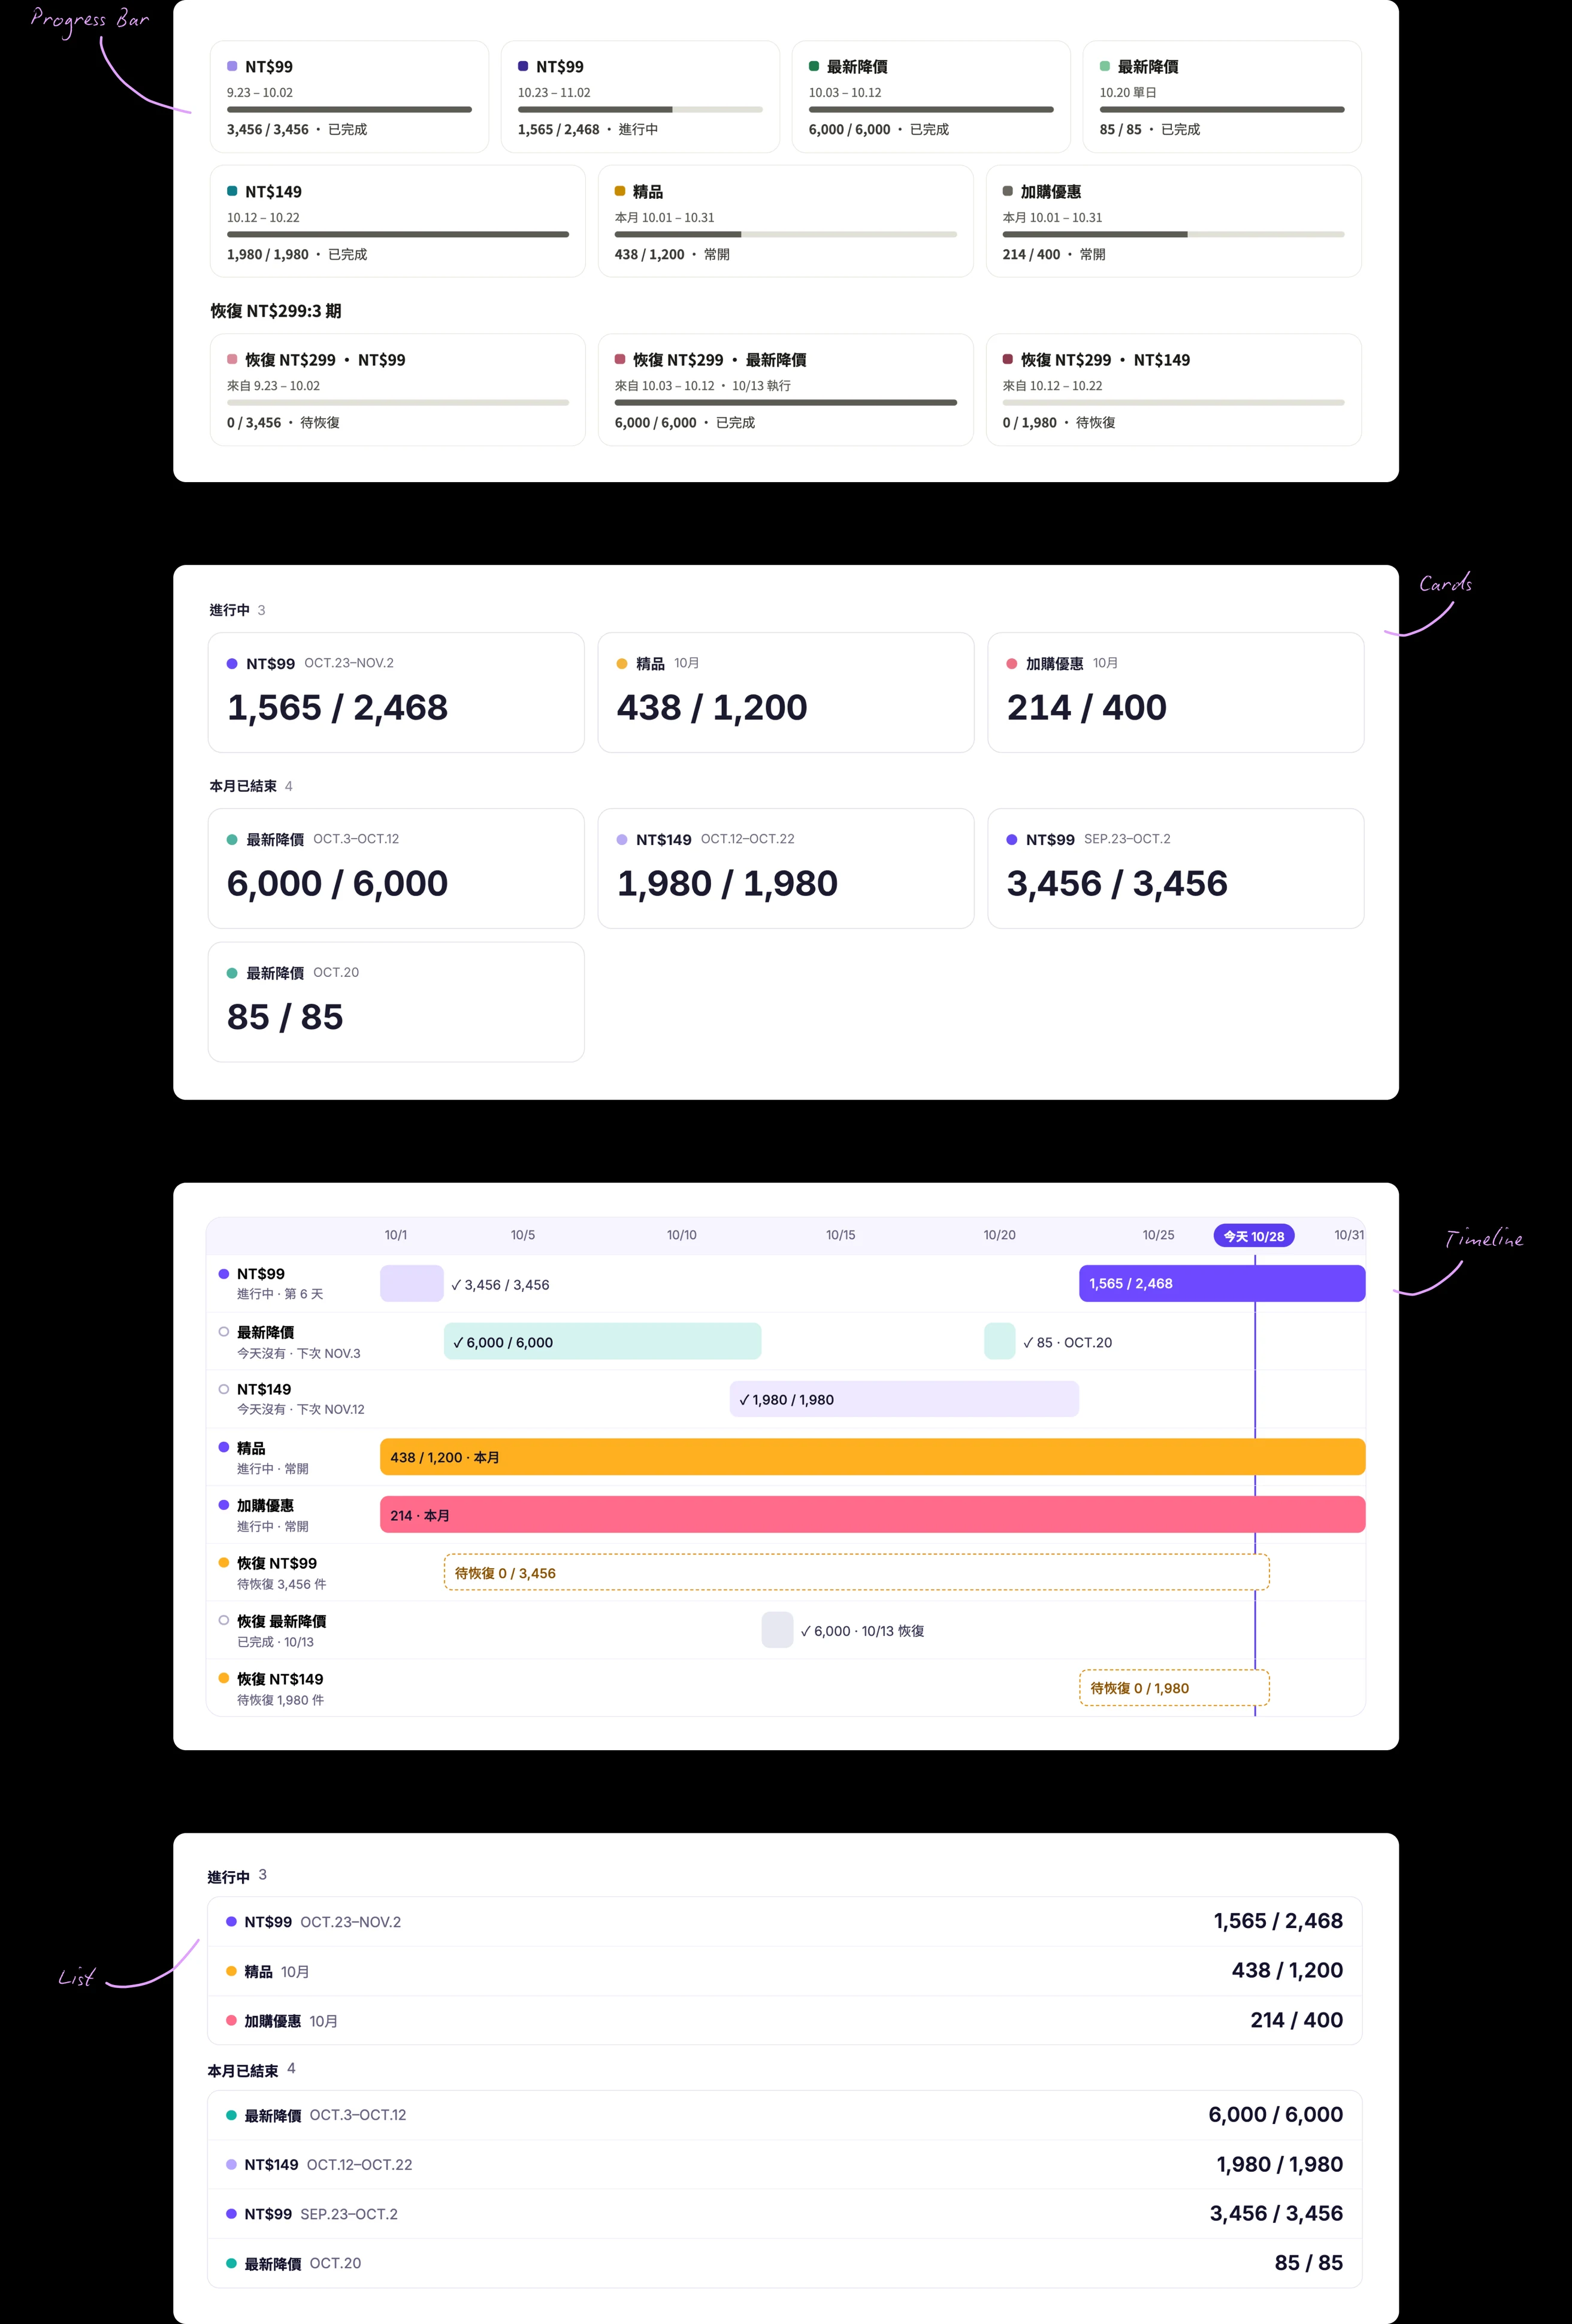
For monthly progress, I explored grouped cards, lists, progress bars, and a timeline. Each offered a different way to compare activity across zones and understand how the month was progressing.
Swipe to see the full image →
As the designs developed, I noticed that both views were showing the same zone totals. The NT$99 zone, for example, appeared in both tabs with the same numbers, just framed from a different perspective. Keeping them separate meant checking two places for one answer.
Swipe to see the full image →
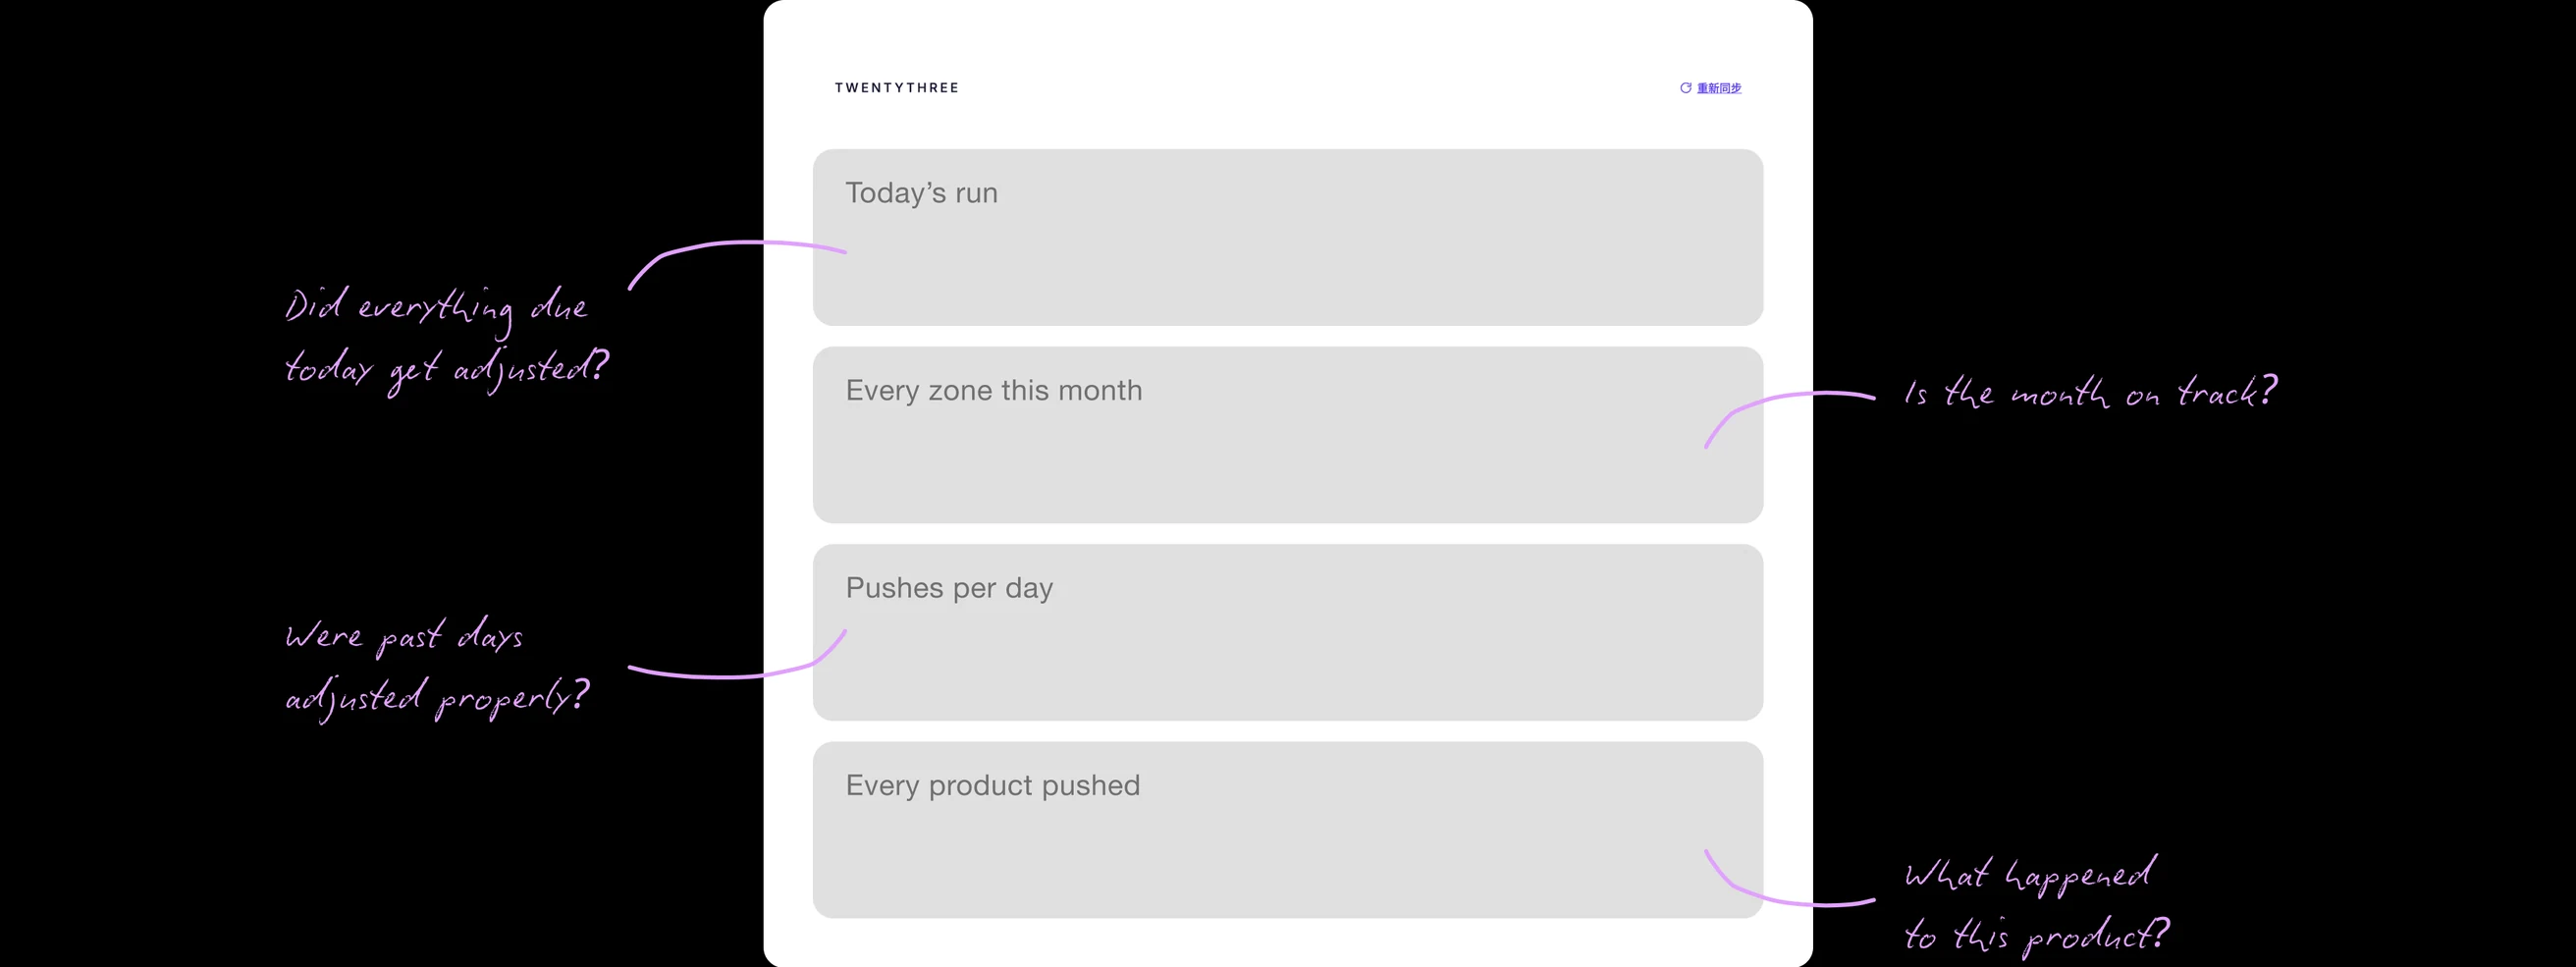
I brought them together on one page: today’s run at the top, monthly progress below, followed by daily results and a searchable product history for investigating individual changes.
Swipe to see the full image →
The top of the dashboard needed to answer one question: did everything due today get adjusted? I explored several ways to present the result, from individual zone cards and progress bars to a single summary banner. I wanted the overall status to be clear without requiring the merchandiser to compare multiple elements.
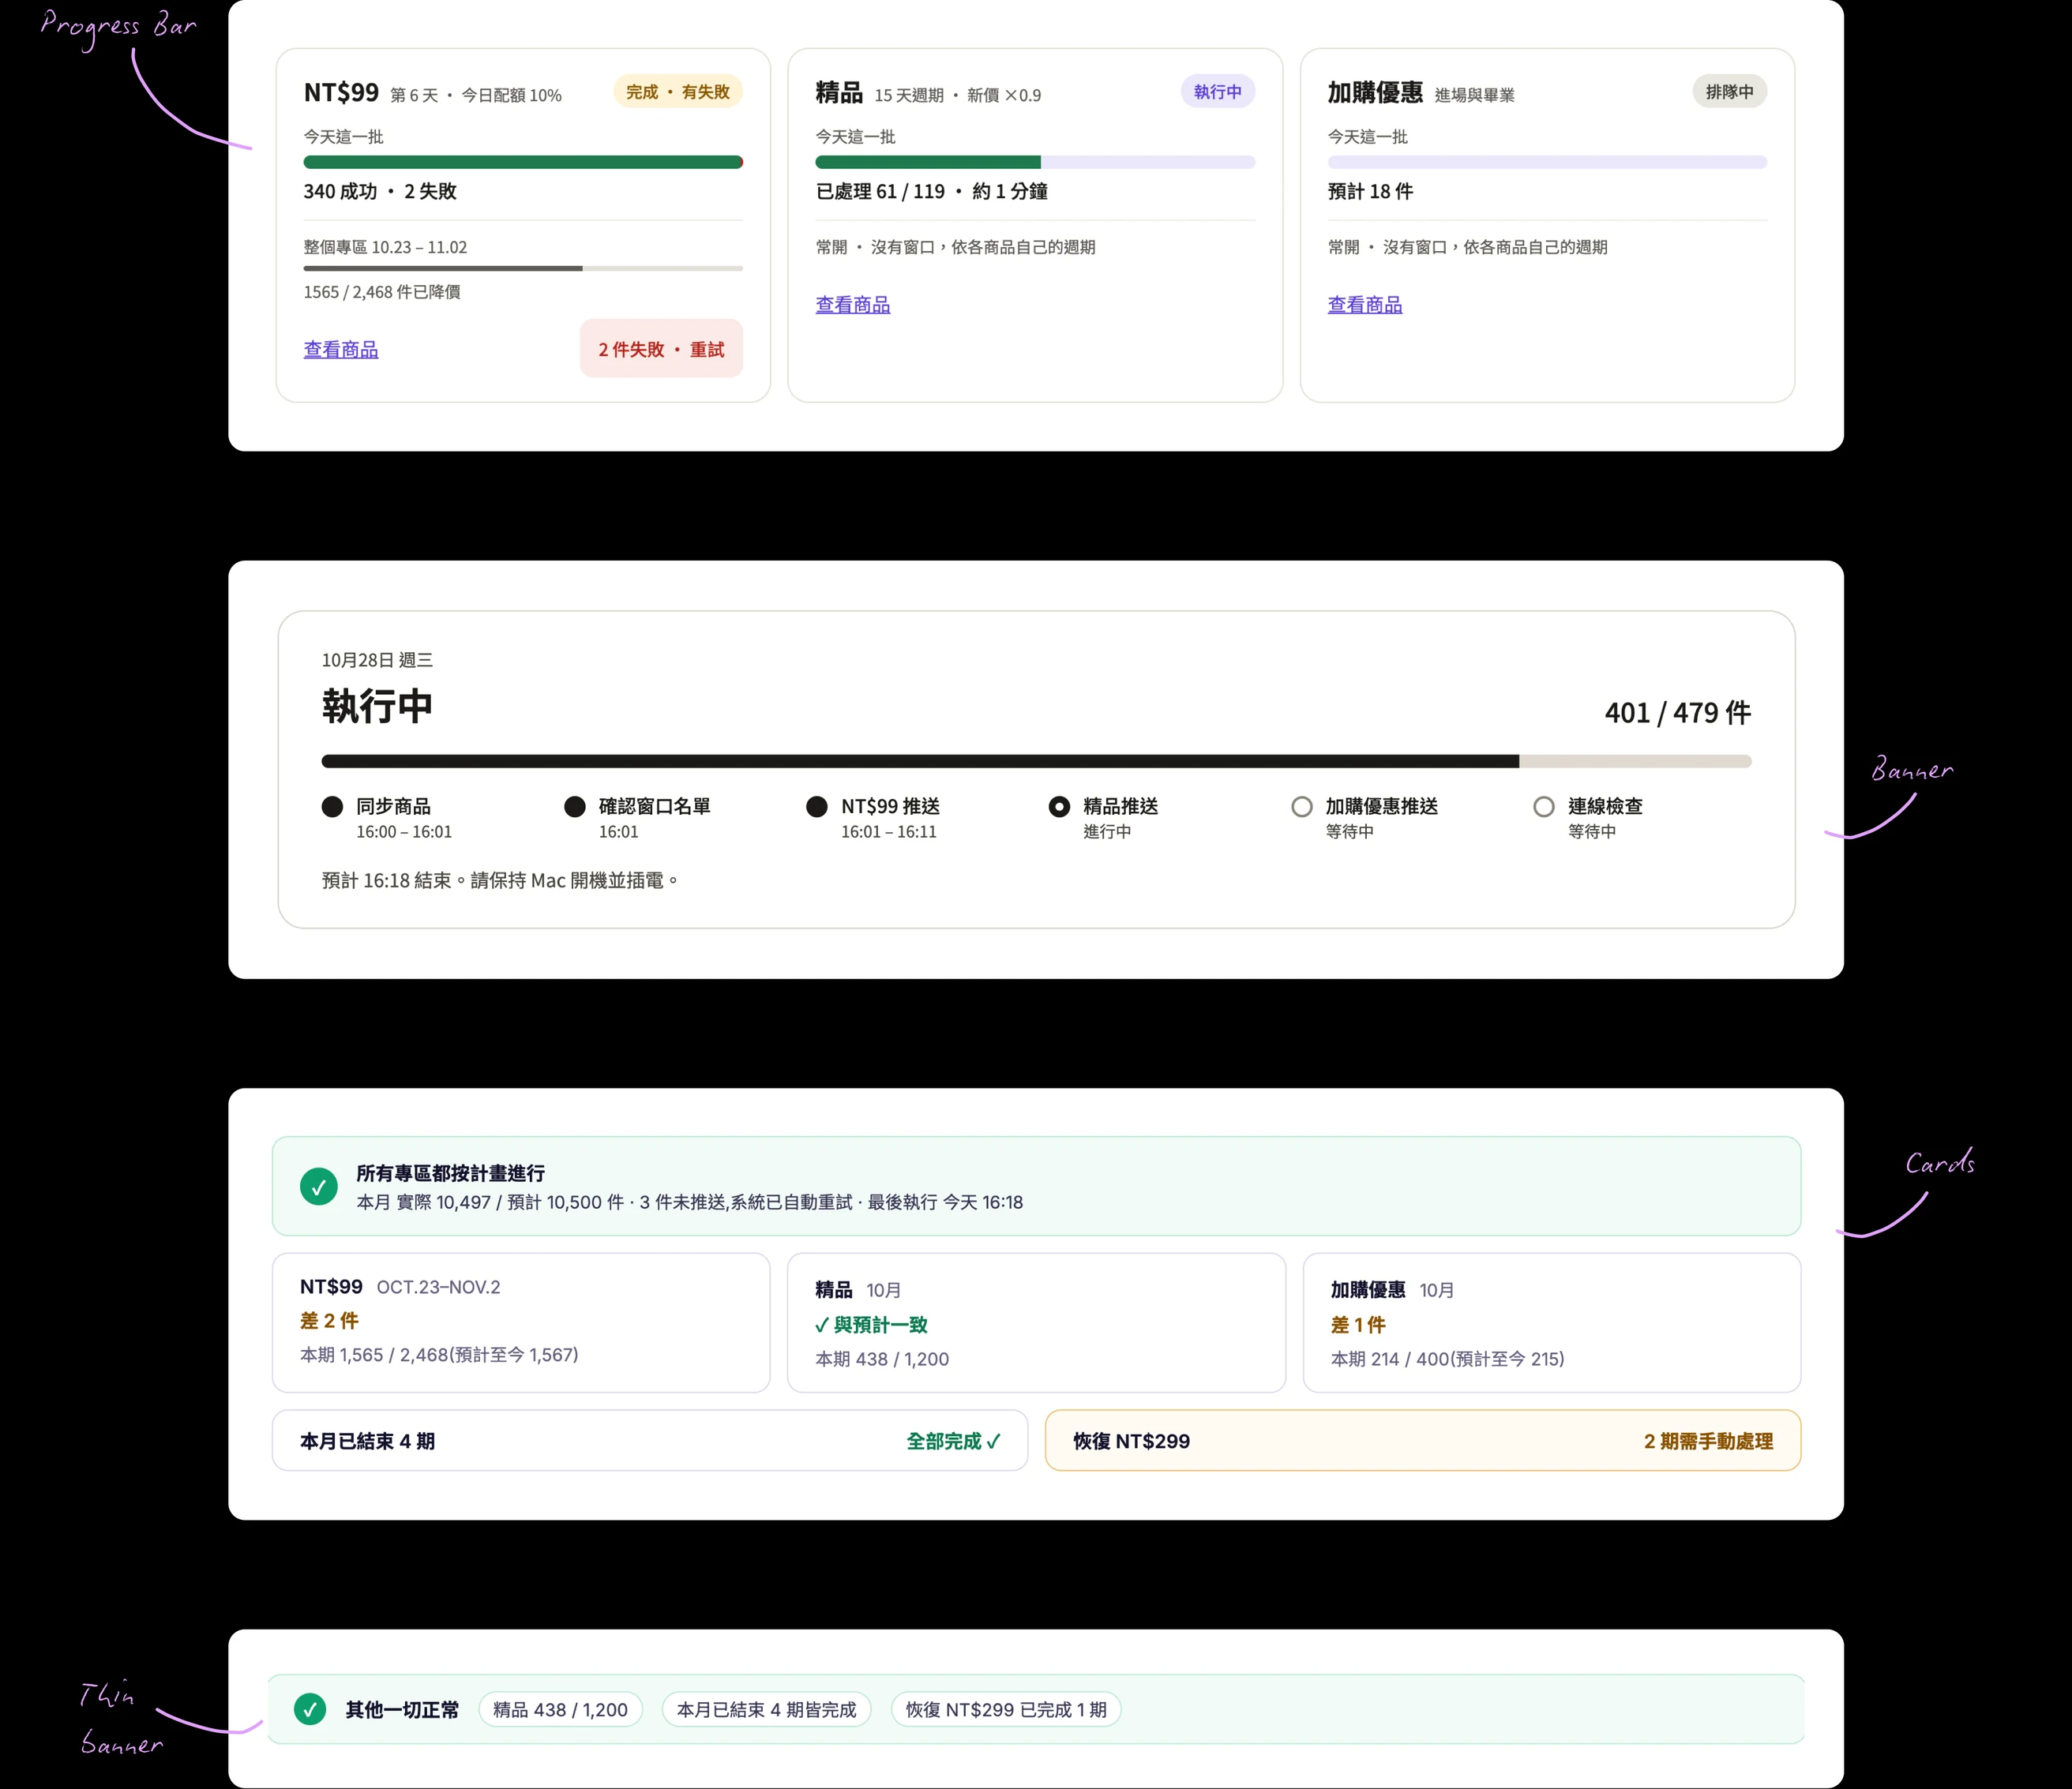
Swipe to see the full image →
I chose to go with the banner because it made the overall result clear at a glance. I then explored four versions of the banner, testing progress bars, a list, a pie chart, and a sequence of steps. The progress-bar version struck the best balance: the overall status was immediately clear, while individual bars made it easy to spot which zones fell short.
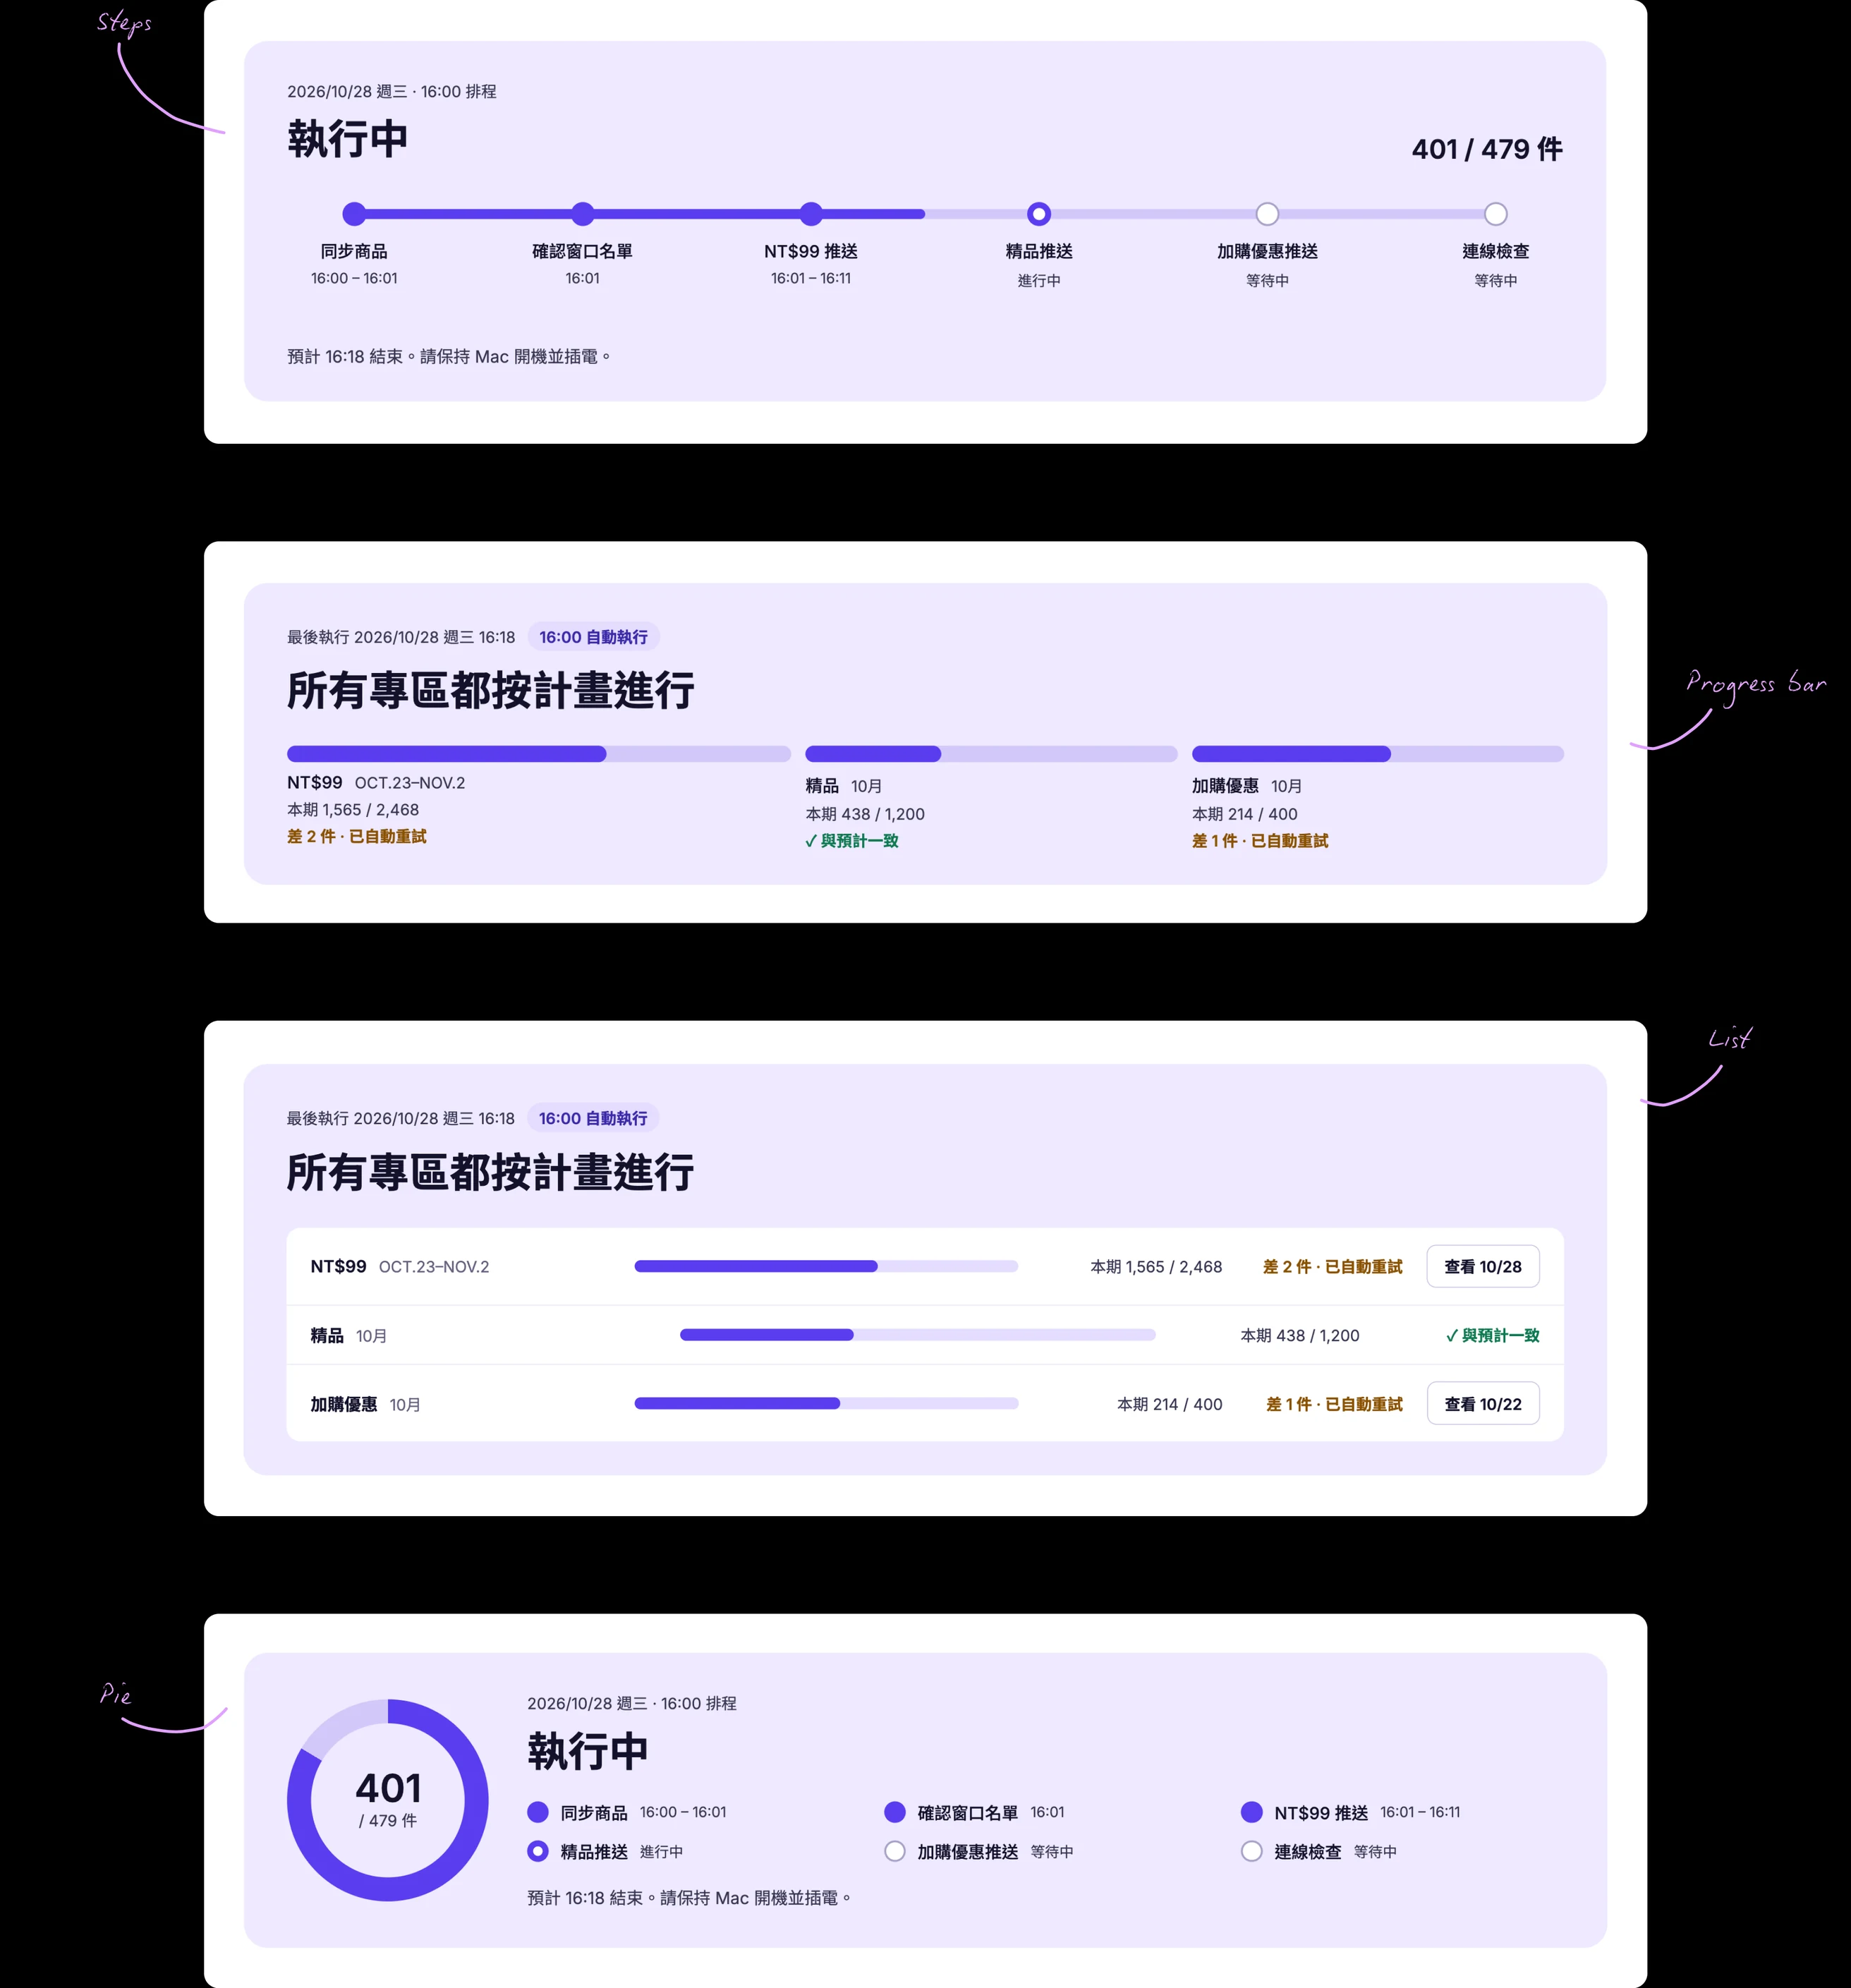
Swipe to see the full image →
Because the rest of the dashboard contains a lot of data and charts, I also tested the banner with and without an illustration. I added a simple visual anchor to draw attention to the run status and make the most important information easier to find.

Swipe to see the full image →
Previously, monthly totals appeared in separate cards above the daily chart. I moved the totals alongside the chart, so the team could see each zone’s progress for the month while comparing daily results. Selecting any day reveals its breakdown, bringing the overview and day-level detail into one view.
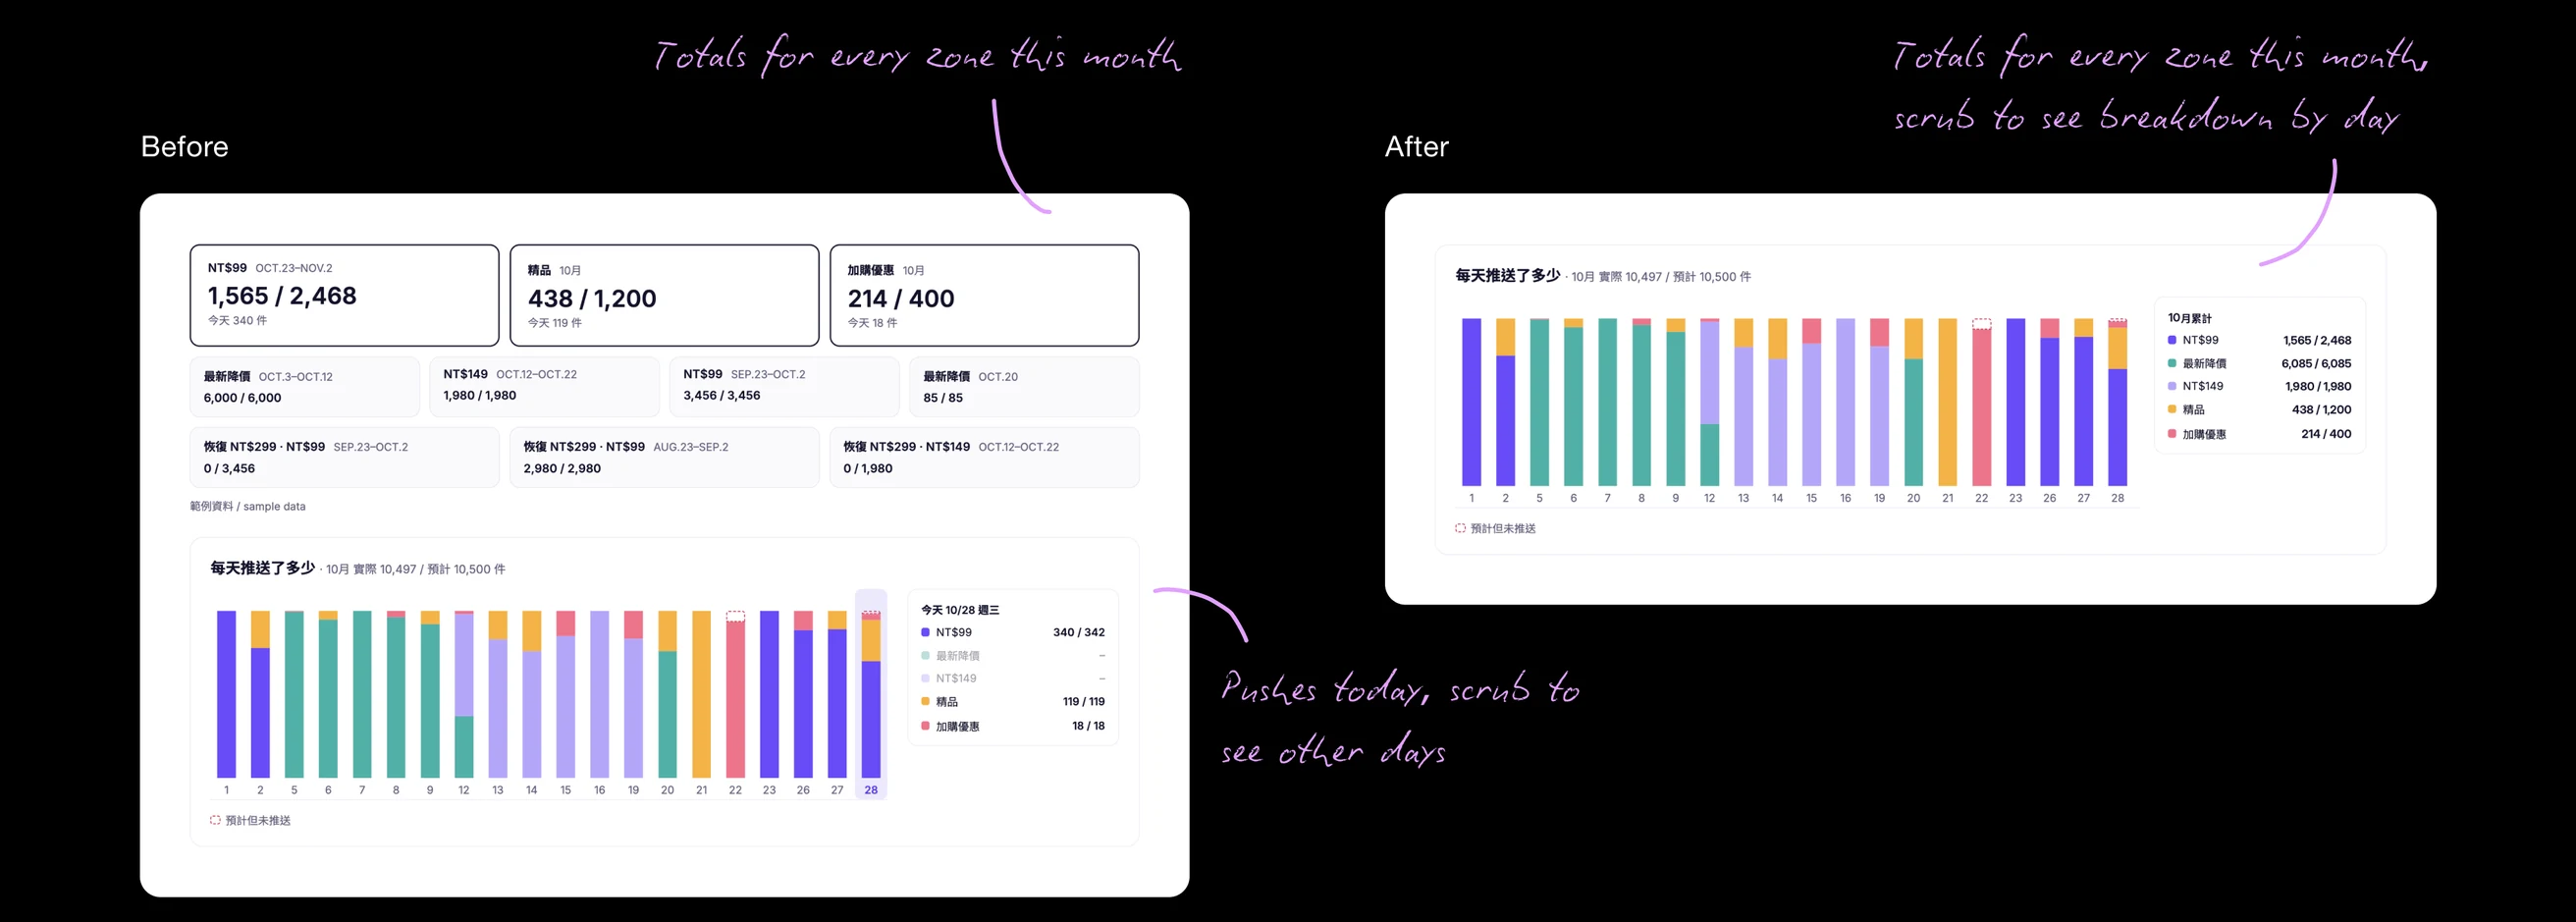
Swipe to see the full image →
The team needed to see whether each pricing zone was running on schedule, while still being able to investigate a specific day. I explored five directions: a line graph, daily bar chart, calendar, timeline, and a separate row for each zone.
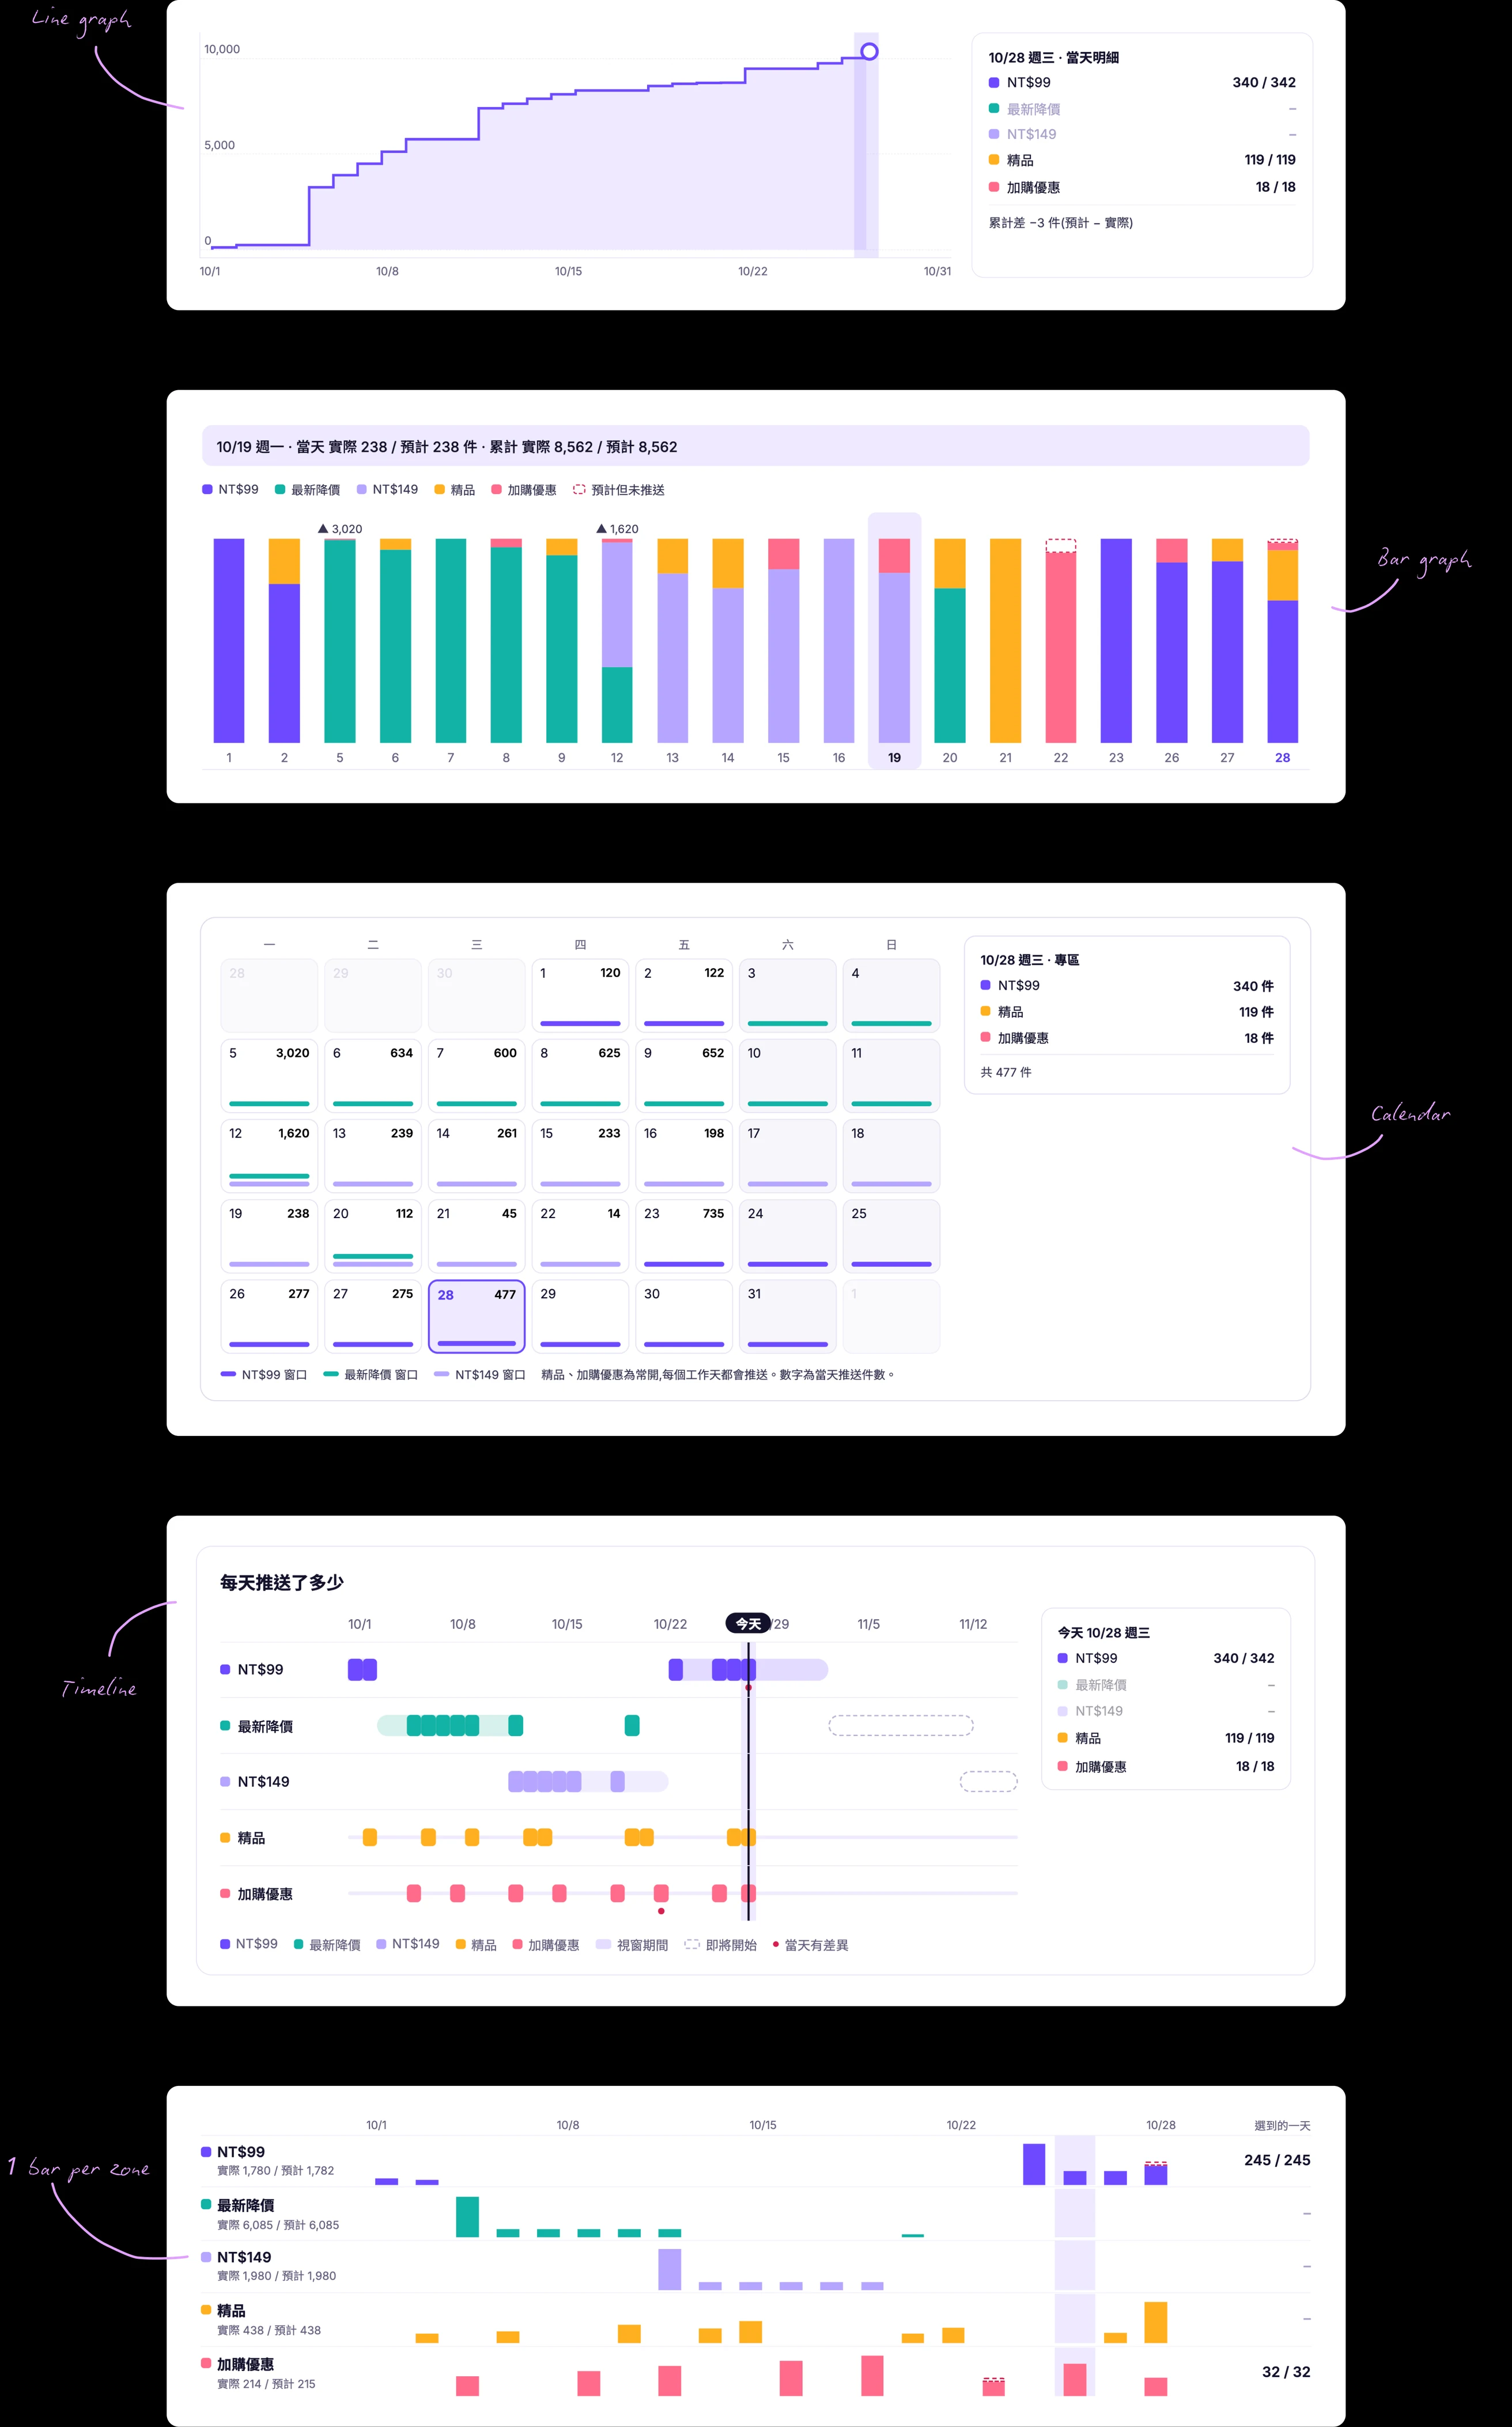
Swipe to see the full image →
I narrowed the options to a daily bar chart and a timeline, then explored how someone would inspect an individual day’s results.
For the bar chart, I tested showing the selected day’s breakdown below the chart, in a tooltip, or in a separate card.
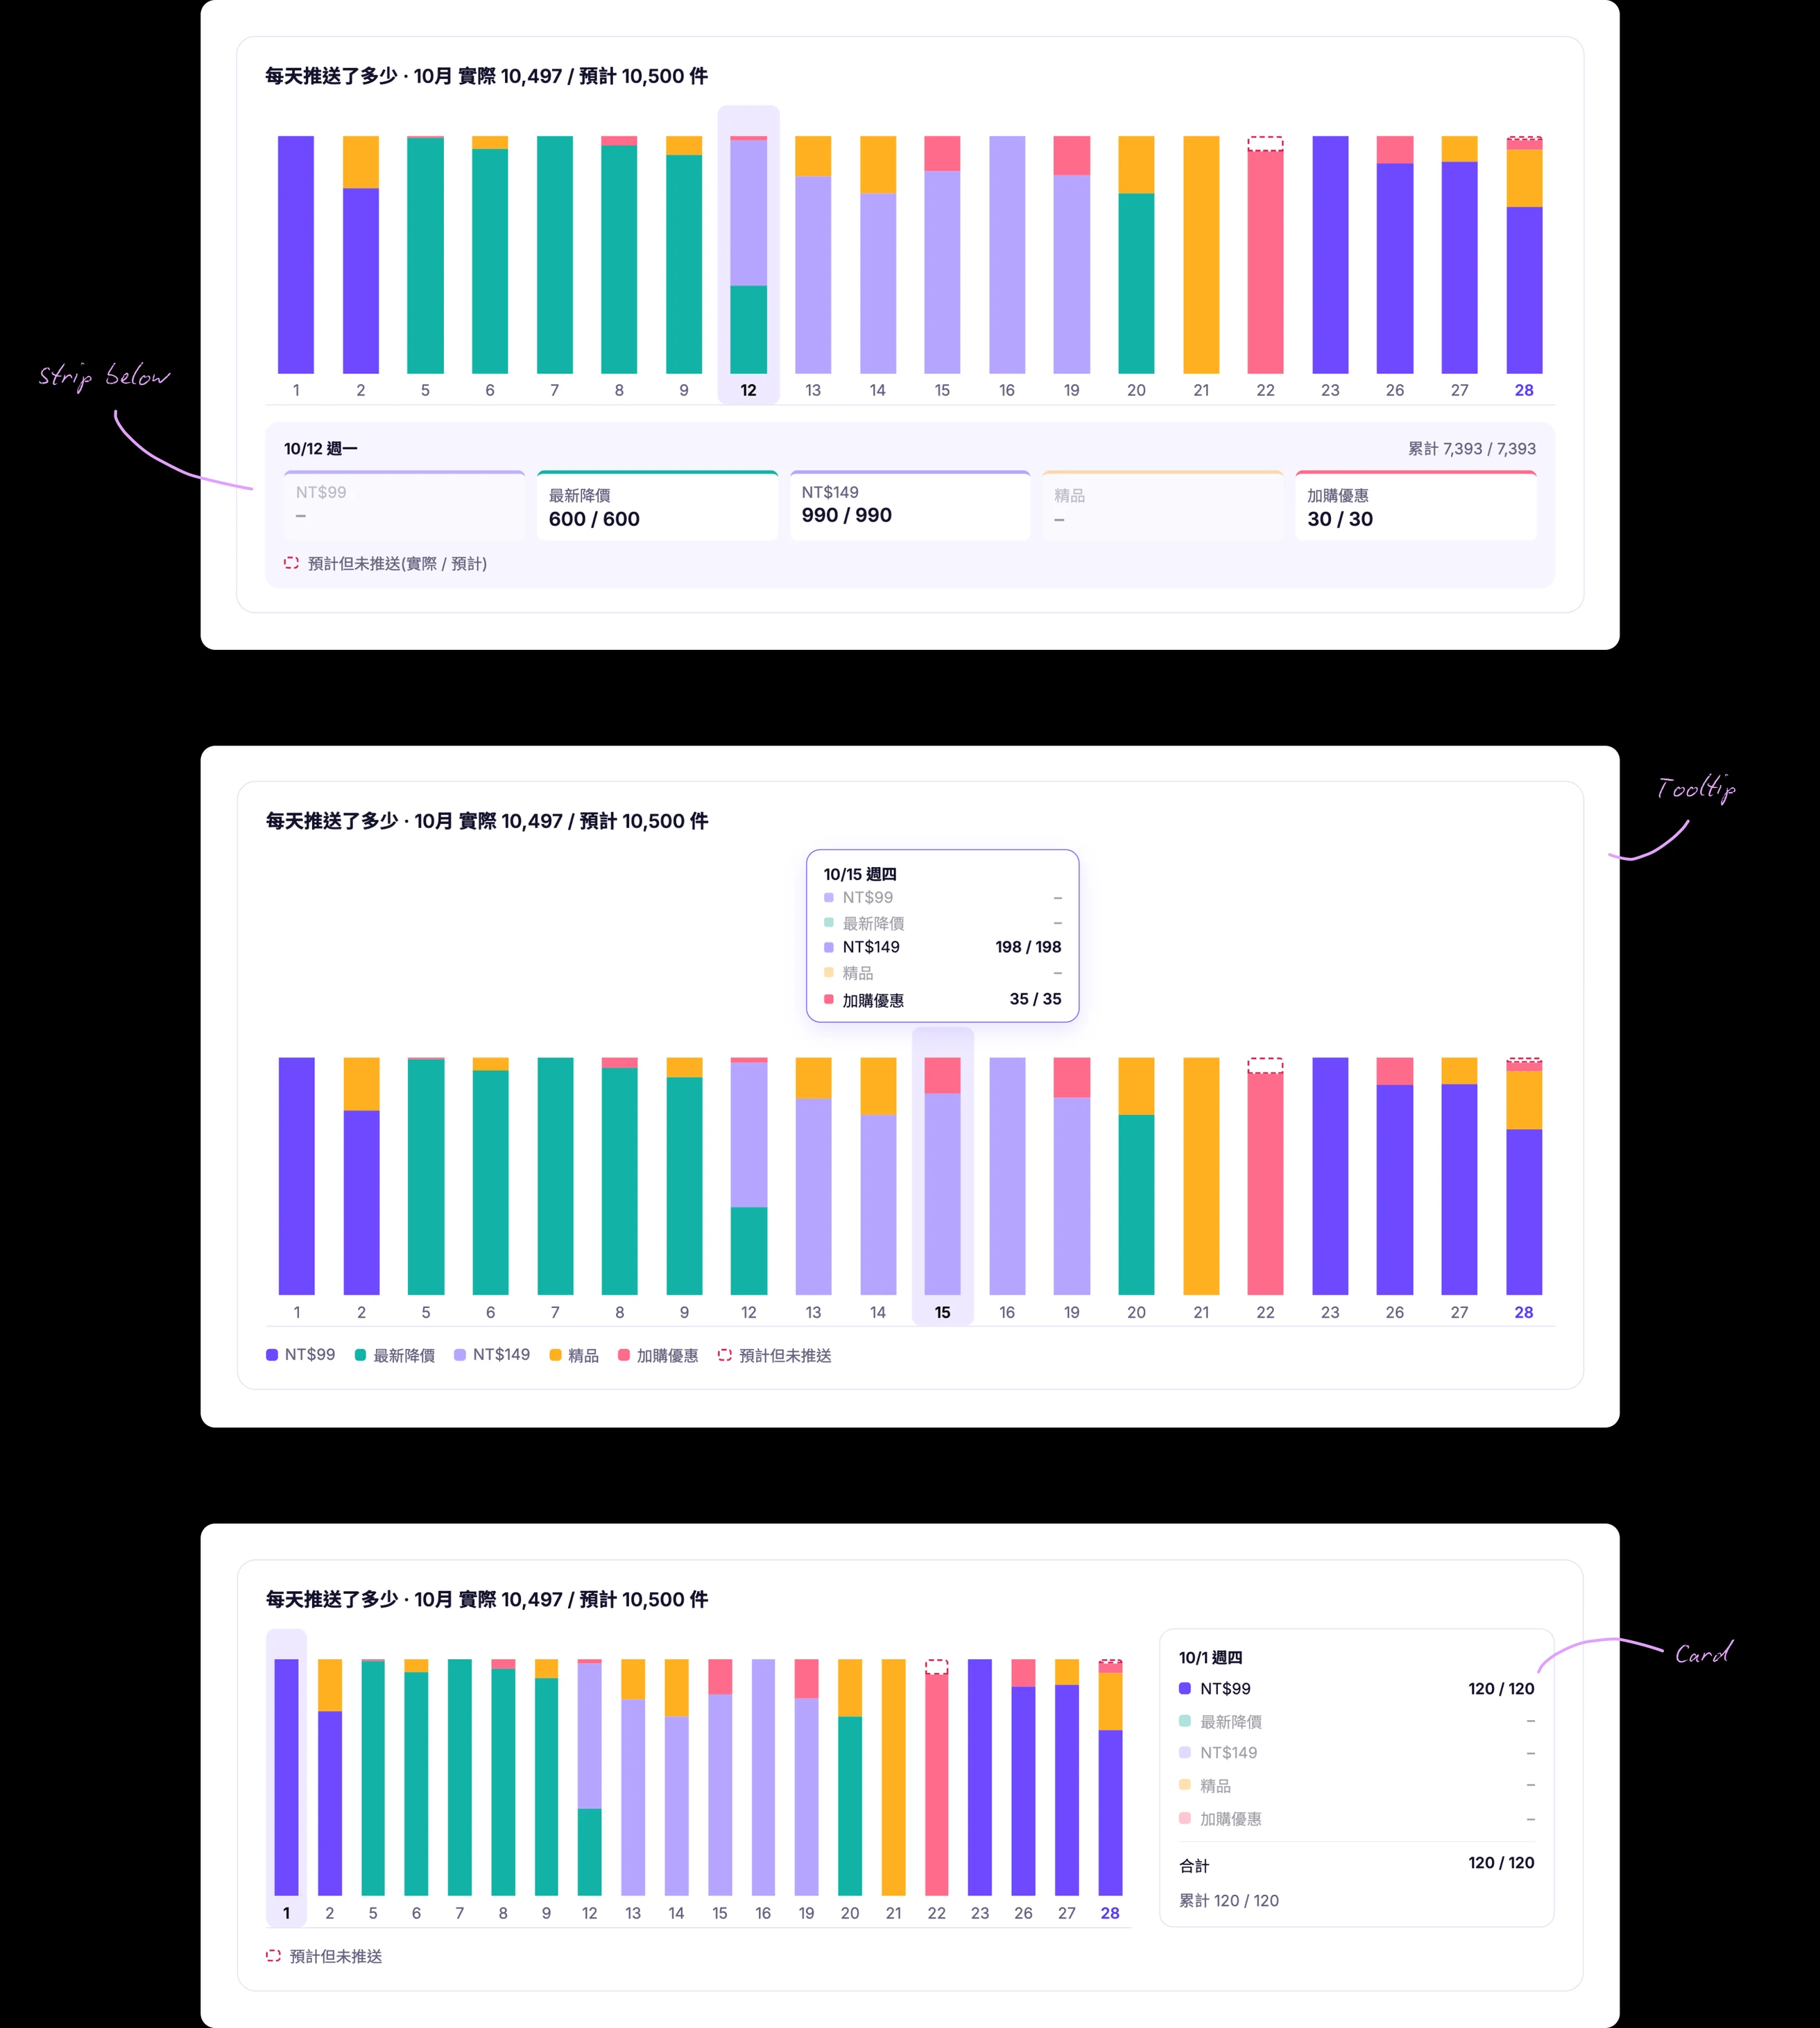
Swipe to see the full image →
For the timeline, I tested different ways to group the five pricing zones so the schedule would remain readable without losing important distinctions.
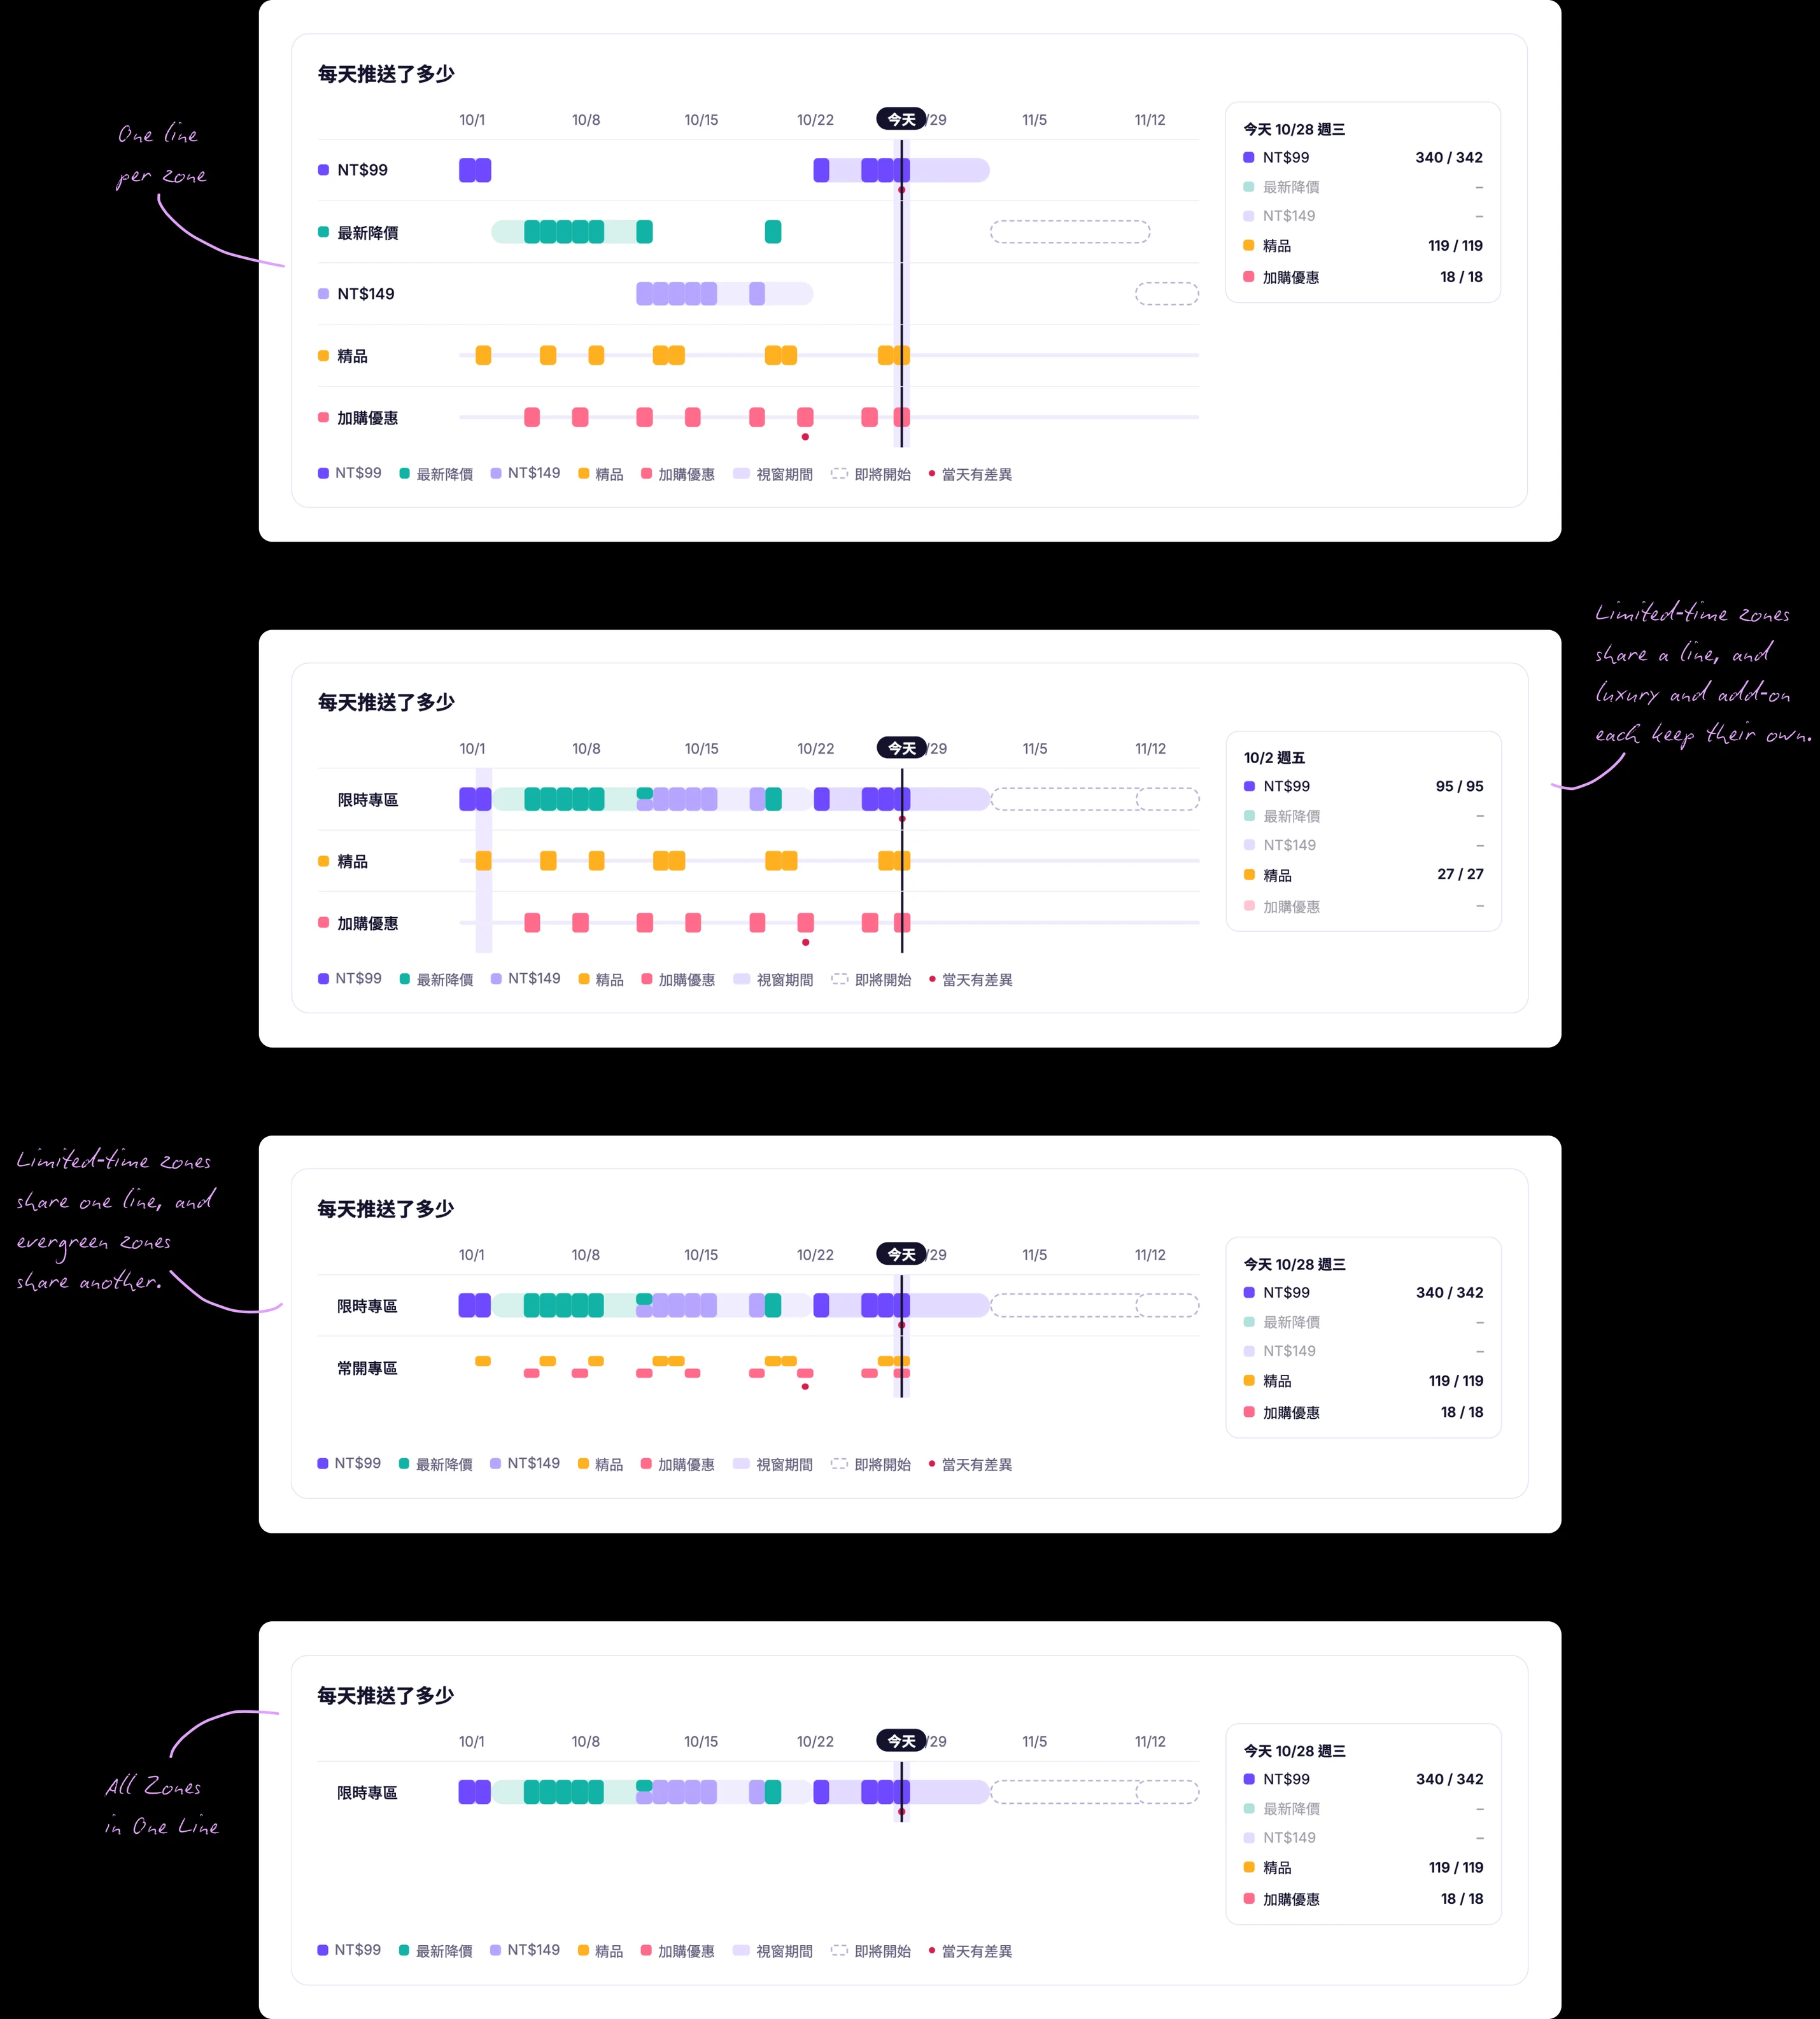
Swipe to see the full image →
After reviewing the options with the merchandiser, I chose a timeline with two lines. It made the monthly schedule easiest to understand at a glance while keeping individual days accessible. Light bands show when each pricing zone is active, and dark marks show the days when products were actually updated. This makes it easy to spot whether updates are happening when expected.
Today’s run appears first, followed by the monthly timeline and a searchable table of every product updated. The team gets an immediate overview without losing the ability to investigate individual changes.
Sometimes the team needs to check results even when they’re away from their computers. The mobile experience keeps the same information hierarchy as desktop: today’s run, monthly progress, and recent product updates. The timeline also lets the team select a day to inspect its results.
Rather than stopping at static prototypes, I built against the actual SHOPLINE catalog. This let me test how the experience handled thousands of real products, not just idealized sample data.
I used three tools for different parts of the process:
1
Claude
Explore concepts and work through product requirements.
2
Figma
Refine the interface, including layout, hierarchy, copy, and states.
3
Cursor
Build and test the working experience against real product data.
I tested the tool with the merchandiser in weekly sessions and regular check-ins. We shared updates and findings in a stakeholder channel so the founders and merchandiser could stay aligned.
Because the tool changes live prices, I also built in safeguards: price decreases are capped at 10%, and updates pause when product data doesn’t match the expected values.
The tool is covered by automated tests and manual checks. With a larger engineering team, I would add a staging environment, pre-release test automation, access controls, monitoring, and engineering review of the architecture.
Testing against real data
I prototyped directly in the existing tool rather than waiting for a separate development environment, which let me test ideas against real product data and workflows much faster. Because I was working in a live environment, I clearly communicated what was still in progress and personally verified every change end-to-end.
Using AI as a development partner
Claude and Cursor helped me move between product definition, design, and implementation without a traditional engineering handoff. I remained responsible for the requirements, business logic, design quality, and final validation. For a small startup without dedicated resources for a 6–10 week agency build, this allowed us to validate the product and get it into use much faster.
AI made implementation and iteration faster, but it did not replace product judgment. I used it to explore options and build the tool, while making the decisions about what to build and how it should work.
My development workflow
1
Define the product
Work with Claude on a PRD that captures requirements, expected behavior, and business rules.
2
Explore and refine
Use AI to explore initial design directions, then refine the interface and details myself.
3
Investigate and build
Have Claude plan the implementation and Cursor investigate the codebase. Once the approach is clear, Cursor implements and Claude reviews.
4
Validate
Test the result against real workflows and product data before committing changes.
9h0m
Manual work per pricing cycle
+14%
Monthly sell-through
+33%
Promotional traffic